อ่านรายละเอียดเพิ่มเติม


 16.06.2022 02:44 PM
The GBP/USD pair showed notable growth yesterday after the US Federal Reserve raised the rate by 75 instead of 50 basis points as was previously expected. Probably, the scenario of a rate hike of 75 basis points has already been priced in by the USD traders. How else can we explain such a sell-off in the US dollar? On the other hand, the same situation happened after the two previous rate hikes. The only difference was that traders were selling the greenback because the rate increase came in line with expectations. Yesterday, however, the Fed made a more aggressive move.
Yet, it seems that the pound bulls won't celebrate this victory for too long. Today, the Bank of England is due to announce its decision on the rate which is likely to be raised by only 25 basis points. However, if the UK regulator hikes the rate by 50 basis points instead of 25, this will definitely prompt the strengthening of the British currency. A lot will depend on the meeting minutes and the rhetoric of BoE's Governor Andrew Bailey. And now let's have a look at the GBP/USD chart.
Daily chart
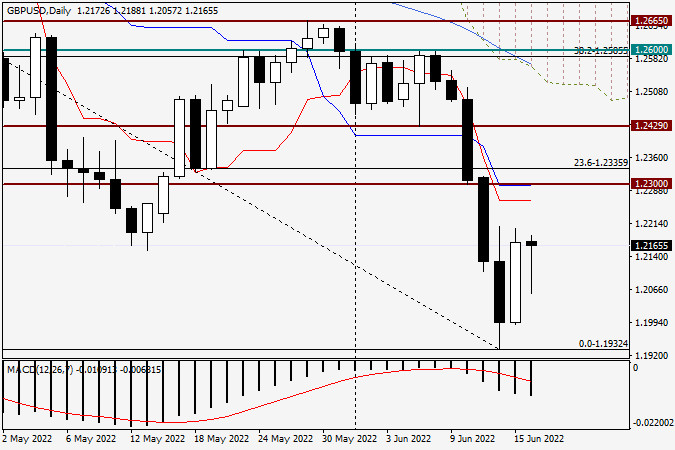
In yesterday's session, the pound/dollar pair notably advanced and closed the day at the level of 1.2172. Therefore, my assumptions about a corrective pullback towards 1.2200 and even 1.2300 made sense. At least, the price closely approached the level of 1.2200. Today, the pair has already pulled back to 1.2057, creating an opportunity to buy the pound. At the moment of writing, the pound/dollar pair is rapidly recovering from recent losses. Moreover, today's daily candlestick has formed a rather long lower shadow. However, when the BoE releases its decision on the rate, the technical picture for GBP/USD may change dramatically. You should keep this in mind and trade accordingly.
H4 chart
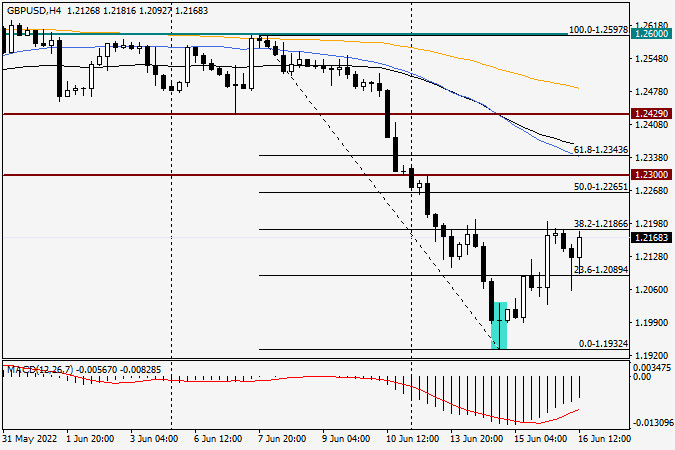
On the 4-hour chart, the reversal candlestick pattern called the Long-legged Doji that I mentioned yesterday has caused the required reaction in the market. In other words, traders took this signal into account, and the price began to rise. According to the Fibonacci grid stretched on a decline between 1.2597 and 1.1932, the pair managed to pull back to the 38.2 Fibonacci retracement. At this point, the price has faced strong resistance from sellers just below the level of 23.6. A very long shadow of the previous candlestick on the 4-hour chart and the current rise give hope that yesterday's uptrend can continue. It is quite obvious, though, that the trajectory of the pair today will mostly depend on the Bank of England's decision. That is why I wouldn't give any specific recommendations on trading the GBP/USD pair. One thing is for sure - today's volatility will be extremely high, so you should be very cautious.
Good luck!
You have already liked this post today
*บทวิเคราะห์ในตลาดที่มีการโพสต์ตรงนี้ เพียงเพื่อทำให้คุณทราบถึงข้อมูล ไม่ได้เป็นการเจาะจงถึงขั้นตอนให้คุณทำการซื้อขายตาม
ลิงก์ที่มีประโยชน์: บทความอื่นๆ ของฉันสามารถอ่านได้ในส่วนนี้ คอร์ส InstaForex สำหรับผู้เริ่มต้น การวิเคราะห์ยอดนิยม เปิดบัญชีซื้อขาย สำคัญ: ผู้เริ่มต้นในตลาดซื้อขาย Forex ต้องระมัดระวังอย่างมากในการตัดสินใจที่จะเข้าสู่ตลาด ก่อนการเปิดเผยรายงานสำคัญ ควรหลีกเลี่ยงการซื้อขายในตลาดเพื่อป้องกันตัวเองจากความผันผวนที่รุนแรงของตลาดอันเนื่องมาจากการเพิ่มขึ้นของความผันผวน หากคุณตัดสินใจที่จะทำการซื้อขายในช่วงที่มีการเผยแพร่ข่าว
เมื่อปรากฏรูปแบบ Divergent และ Descending Broadening Wedge บนกราฟแท่งเทียน 4 ชั่วโมงของคู่สกุลเงิน AUD/JPY แม้ว่าการเคลื่อนไหวของราคาจะต่ำกว่าค่าเฉลี่ย EMA (21) ซึ่งมีแนวโน้มที่ลดลง แต่ข้อมูลทั้งสองนี้เป็นสัญญาณว่าในอนาคตอันใกล้นี้
ในกราฟเวลา 4 ชั่วโมงของคู่สกุลเงินหลัก USD/JPY สามารถสังเกตเห็นได้ว่า ตัวชี้วัด Stochastic Oscillator ได้สร้างรูปแบบ Double Bottom ขึ้นมา ในขณะที่การเคลื่อนไหวของราคา USD/JPY
ในช่วงต้นของการซื้อขายในตลาดอเมริกา ราคาทองคำกำลังซื้อขายอยู่ที่ระดับประมาณ 3,310 ซึ่งตั้งอยู่ที่ 21SMA และอยู่ภายในรูปแบบสามเหลี่ยมสมมาตรที่เกิดขึ้นเมื่อวันที่ 23 เมษายน การรวมราคาน่าจะเกิดขึ้นในอีกไม่กี่วันข้างหน้าในขณะที่รอการประกาศที่สำคัญ สำหรับข่าวนี้ ประธานาธิบดีสหรัฐฯ จะประกาศมาตรการอัตราภาษีสำหรับรถยนต์ มีข่าวลือในตลาดว่า Trump จะผ่อนปรนมาตรการภาษีรถยนต์ซึ่งจะทำให้ความต้องการทองคำลดลง
ในช่วงต้นของเซสชันอเมริกัน คู่เงิน EUR/USD มีการซื้อขายอยู่ใกล้ระดับ 1.1393 ภายในรูปแบบสามเหลี่ยมสมมาตรที่เกิดขึ้นตั้งแต่วันที่ 22 เมษายน ยูโรแสดงสัญญาณการปรับฐาน แต่ยังมีการสังเกตว่ามีการเหนื่อยล้าของแรงขาขึ้น ซึ่งเราคิดว่ายูโรอาจมีการปรับฐานทางเทคนิคในอีกไม่กี่ชั่วโมงข้างหน้า หากยูโรสามารถลดลงต่ำกว่ารูปแบบสามเหลี่ยมสมมาตรและสามารถปรับฐานต่ำกว่า 1.1370 มันจะถูกมองว่าเป็นโอกาสในการขายโดยมีเป้าหมายที่ 6/8
ลิงก์ที่เป็นประโยชน์: สามารถอ่านบทความอื่น ๆ ของฉันได้ในส่วนนี้ หลักสูตร InstaForex สำหรับผู้เริ่มต้น การวิเคราะห์ที่ได้รับความนิยม เปิดบัญชีซื้อขาย ข้อควรระวัง: นักเทรดฟอเร็กซ์มือใหม่ต้องระมัดระวังอย่างมากเมื่อทำการตัดสินใจเข้าตลาด ก่อนการประกาศรายงานสำคัญ แนะนำให้หลีกเลี่ยงการเข้าเทรดในตลาดเพื่อหลีกเลี่ยงความผันผวนที่เกิดขึ้นจากตลาดที่มีความผันผวนสูง หากคุณตัดสินใจที่จะเทรดในระหว่างการประกาศข่าว ควรวางคำสั่งหยุดขาดทุนเสมอเพื่อจำกัดการสูญเสีย
ในช่วงเช้าของการซื้อขายในสหรัฐอเมริกา ยูโรซื้อขายอยู่ที่ประมาณ 1.1349 ในแชนแนลของแนวโน้มที่ลดลงซึ่งก่อตั้งขึ้นเมื่อวันที่ 18 เมษายน EUR/USD มีการรวมตัวกันในช่วงไม่กี่วันที่ผ่านมาอยู่ที่ประมาณ 1.1340 หากคู่ EUR/USD ทะลุและรวมตัวที่เหนือแชนแนลของแนวโน้มที่ลดลง และที่ระดับสูงกว่า 21SMA ที่ตั้งอยู่ที่
ในช่วงต้นของการซื้อขายในฝั่งอเมริกา ราคาทองคำเคลื่อนไหวอยู่ราว ๆ 3,299 ภายในช่องแนวโน้มที่ลดลงซึ่งเริ่มก่อตัวตั้งแต่วันที่ 21 เมษายน แสดงถึงการฟื้นตัวเหนือแนวรับที่ 3,270 ที่กราฟ H4 เราสามารถเห็นการรวมตัวของราคา $100 จาก 3,370
เมื่อสัปดาห์ที่แล้ว ฝ่ายซื้อได้ปรับค่าจุดสูงสุดทางประวัติศาสตร์และสร้างค่าจุดสุดขีดใหม่ที่ 3499.58 หลังจากนั้น ทองคำได้เข้าสู่การปรับฐานลงไปในแนวสนับสนุนของแนวโน้มระยะสั้นประจำวันที่ 3346.45 ตลาดได้หยุดชะงัก หากความรู้สึกของฝ่ายขายได้รับแรงกระตุ้นใหม่เพื่อพัฒนาต่อไป เป้าหมายถัดไปจะเป็นแนวโน้มระยะกลางประจำวันที่ 3227.79 และการปรับฐานลงอาจขยายไปยังแนวสนับสนุนของแนวโน้มระยะสั้นรายสัปดาห์ที่ 3164.81 การกำจัดจุดไขว้สีทองประจำวันที่ 3163.64 และการยืนต่ำกว่าแนวรายสัปดาห์ที่
สัปดาห์ที่แล้ว ตลาดได้ปรับปรุงระดับต่ำสุดใหม่ แต่ผู้ขายไม่สามารถทำให้การเคลื่อนไหวลงต่อไปได้อย่างเต็มที่ อาจเป็นเพราะระดับต่ำสุดของสัปดาห์ก่อนหน้านี้ (141.63) ได้รับการสนับสนุนเพิ่มเติมจากระดับสนับสนุนรายเดือน (141.96) ส่งผลให้การลดลงหยุดชะงัก และคู่สกุลเงินนี้เริ่มมีการปรับตัวขึ้น ในการปรับตัวขึ้นนี้ ฝ่ายซื้อสามารถกลับมาเรียกคืนการสนับสนุนจากแนวโน้มระยะสั้นในกรอบรายวัน ซึ่งปัจจุบันตั้งอยู่ที่ 141.97 และยังคงดันราคาขึ้นเรื่อยๆ เป้าหมายที่ใกล้ในตอนนี้
ตารางของ Forex
เวอร์ชั่นแบบ หน้าเว็บไซต์

Your IP address shows that you are currently located in the USA. If you are a resident of the United States, you are prohibited from using the services of InstaFintech Group including online trading, online transfers, deposit/withdrawal of funds, etc.
If you think you are seeing this message by mistake and your location is not the US, kindly proceed to the website. Otherwise, you must leave the website in order to comply with government restrictions.
Why does your IP address show your location as the USA?
Please confirm whether you are a US resident or not by clicking the relevant button below. If you choose the wrong option, being a US resident, you will not be able to open an account with InstaTrade anyway.
We are sorry for any inconvenience caused by this message.


