อ่านรายละเอียดเพิ่มเติม


 27.05.2022 10:49 AM
As predicted in my previous review on EUR/USD, the most popular currency pair on Forex developed an upward movement yesterday. This means that market participants have quickly digested the FOMC minutes and resumed the bullish scenario. The fundamental factors also supported the euro bulls. Yesterday, the revised data on US GDP for the first quarter turned out to be below the estimate of -1.3% and actually stood at -1.5%. Against this backdrop, many investors feared that the US Federal Reserve may revise its aggressive approach towards monetary policy and start to ease it.
It is well known that the best way to tackle high inflation is to raise interest rates. However, this method works only when the economy is strong and everything goes according to the Fed's plan. Yesterday's data on GDP in the US showed once again that the world's leading economy is not doing well. Besides, the next two rate hikes of 50 basis points have most likely been priced in by the USD market players. Before moving on to the technical review, let me remind you that today we expect a block of macroeconomic data from the US later in the afternoon. This will include the data on personal income and spending as well as the core personal consumption expenditures price index.
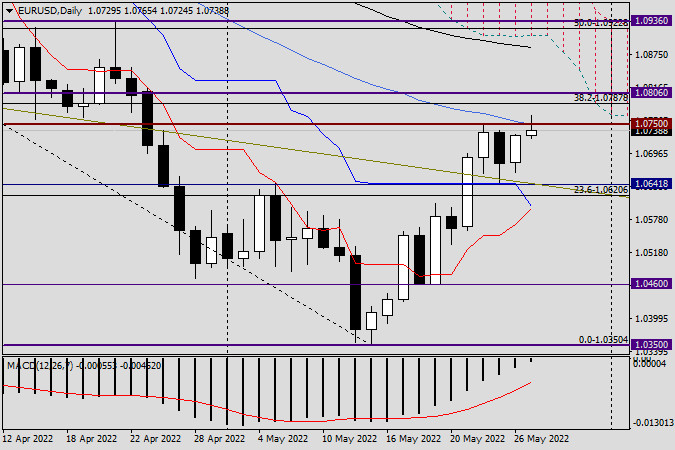
Daily chart
The bullish candlestick from yesterday with a closing price of 1.0729 was a natural transition from the previous black candlestick with a long lower shadow. On May 25, EUR/USD made an accurate pullback to the broken resistance of 1.0641 and then, following the rules of technical analysis, reversed to the upside. At the moment of writing, the euro bulls have already made an attempt to break above the 50-day simple moving average and the strong resistance level of 1.0750. These attempts have failed so far as the price made a downside pullback from this level and the 50-day MA, even though this movement was very weak. If the pair closes the day above 1.0750, this will certainly confirm the bullish scenario, and a close of the weekly session above 1.0767 will further strengthen it. I will talk about this in more detail on Monday. In case a bearish candlestick pattern appears on the daily chart by the end of the day, the quote may struggle to overcome the 50-day MA and the levels of 1 1.0750 and 1.0767 or may even stop doing this.
Trading recommendations. I usually do not recommend opening new positions on Friday so that they are rolled over to Monday. Despite the fact that the bullish scenario is very likely, it is not a good idea to open buy trades under strong resistance levels such as the 50-day MA and the levels of 1.0750 and1.0767. I advise you to stay out of the market today as this is also an option. We will provide a more detailed technical analysis of EUR/USD on Monday based on the result of the weekly session.
Have a good day!
You have already liked this post today
*บทวิเคราะห์ในตลาดที่มีการโพสต์ตรงนี้ เพียงเพื่อทำให้คุณทราบถึงข้อมูล ไม่ได้เป็นการเจาะจงถึงขั้นตอนให้คุณทำการซื้อขายตาม
ลิงก์ที่มีประโยชน์: บทความอื่นๆ ของฉันสามารถอ่านได้ในส่วนนี้ คอร์ส InstaForex สำหรับผู้เริ่มต้น การวิเคราะห์ยอดนิยม เปิดบัญชีซื้อขาย สำคัญ: ผู้เริ่มต้นในตลาดซื้อขาย Forex ต้องระมัดระวังอย่างมากในการตัดสินใจที่จะเข้าสู่ตลาด ก่อนการเปิดเผยรายงานสำคัญ ควรหลีกเลี่ยงการซื้อขายในตลาดเพื่อป้องกันตัวเองจากความผันผวนที่รุนแรงของตลาดอันเนื่องมาจากการเพิ่มขึ้นของความผันผวน หากคุณตัดสินใจที่จะทำการซื้อขายในช่วงที่มีการเผยแพร่ข่าว
เมื่อปรากฏรูปแบบ Divergent และ Descending Broadening Wedge บนกราฟแท่งเทียน 4 ชั่วโมงของคู่สกุลเงิน AUD/JPY แม้ว่าการเคลื่อนไหวของราคาจะต่ำกว่าค่าเฉลี่ย EMA (21) ซึ่งมีแนวโน้มที่ลดลง แต่ข้อมูลทั้งสองนี้เป็นสัญญาณว่าในอนาคตอันใกล้นี้
ในกราฟเวลา 4 ชั่วโมงของคู่สกุลเงินหลัก USD/JPY สามารถสังเกตเห็นได้ว่า ตัวชี้วัด Stochastic Oscillator ได้สร้างรูปแบบ Double Bottom ขึ้นมา ในขณะที่การเคลื่อนไหวของราคา USD/JPY
ในช่วงต้นของการซื้อขายในตลาดอเมริกา ราคาทองคำกำลังซื้อขายอยู่ที่ระดับประมาณ 3,310 ซึ่งตั้งอยู่ที่ 21SMA และอยู่ภายในรูปแบบสามเหลี่ยมสมมาตรที่เกิดขึ้นเมื่อวันที่ 23 เมษายน การรวมราคาน่าจะเกิดขึ้นในอีกไม่กี่วันข้างหน้าในขณะที่รอการประกาศที่สำคัญ สำหรับข่าวนี้ ประธานาธิบดีสหรัฐฯ จะประกาศมาตรการอัตราภาษีสำหรับรถยนต์ มีข่าวลือในตลาดว่า Trump จะผ่อนปรนมาตรการภาษีรถยนต์ซึ่งจะทำให้ความต้องการทองคำลดลง
ในช่วงต้นของเซสชันอเมริกัน คู่เงิน EUR/USD มีการซื้อขายอยู่ใกล้ระดับ 1.1393 ภายในรูปแบบสามเหลี่ยมสมมาตรที่เกิดขึ้นตั้งแต่วันที่ 22 เมษายน ยูโรแสดงสัญญาณการปรับฐาน แต่ยังมีการสังเกตว่ามีการเหนื่อยล้าของแรงขาขึ้น ซึ่งเราคิดว่ายูโรอาจมีการปรับฐานทางเทคนิคในอีกไม่กี่ชั่วโมงข้างหน้า หากยูโรสามารถลดลงต่ำกว่ารูปแบบสามเหลี่ยมสมมาตรและสามารถปรับฐานต่ำกว่า 1.1370 มันจะถูกมองว่าเป็นโอกาสในการขายโดยมีเป้าหมายที่ 6/8
ลิงก์ที่เป็นประโยชน์: สามารถอ่านบทความอื่น ๆ ของฉันได้ในส่วนนี้ หลักสูตร InstaForex สำหรับผู้เริ่มต้น การวิเคราะห์ที่ได้รับความนิยม เปิดบัญชีซื้อขาย ข้อควรระวัง: นักเทรดฟอเร็กซ์มือใหม่ต้องระมัดระวังอย่างมากเมื่อทำการตัดสินใจเข้าตลาด ก่อนการประกาศรายงานสำคัญ แนะนำให้หลีกเลี่ยงการเข้าเทรดในตลาดเพื่อหลีกเลี่ยงความผันผวนที่เกิดขึ้นจากตลาดที่มีความผันผวนสูง หากคุณตัดสินใจที่จะเทรดในระหว่างการประกาศข่าว ควรวางคำสั่งหยุดขาดทุนเสมอเพื่อจำกัดการสูญเสีย
ในช่วงเช้าของการซื้อขายในสหรัฐอเมริกา ยูโรซื้อขายอยู่ที่ประมาณ 1.1349 ในแชนแนลของแนวโน้มที่ลดลงซึ่งก่อตั้งขึ้นเมื่อวันที่ 18 เมษายน EUR/USD มีการรวมตัวกันในช่วงไม่กี่วันที่ผ่านมาอยู่ที่ประมาณ 1.1340 หากคู่ EUR/USD ทะลุและรวมตัวที่เหนือแชนแนลของแนวโน้มที่ลดลง และที่ระดับสูงกว่า 21SMA ที่ตั้งอยู่ที่
ในช่วงต้นของการซื้อขายในฝั่งอเมริกา ราคาทองคำเคลื่อนไหวอยู่ราว ๆ 3,299 ภายในช่องแนวโน้มที่ลดลงซึ่งเริ่มก่อตัวตั้งแต่วันที่ 21 เมษายน แสดงถึงการฟื้นตัวเหนือแนวรับที่ 3,270 ที่กราฟ H4 เราสามารถเห็นการรวมตัวของราคา $100 จาก 3,370
เมื่อสัปดาห์ที่แล้ว ฝ่ายซื้อได้ปรับค่าจุดสูงสุดทางประวัติศาสตร์และสร้างค่าจุดสุดขีดใหม่ที่ 3499.58 หลังจากนั้น ทองคำได้เข้าสู่การปรับฐานลงไปในแนวสนับสนุนของแนวโน้มระยะสั้นประจำวันที่ 3346.45 ตลาดได้หยุดชะงัก หากความรู้สึกของฝ่ายขายได้รับแรงกระตุ้นใหม่เพื่อพัฒนาต่อไป เป้าหมายถัดไปจะเป็นแนวโน้มระยะกลางประจำวันที่ 3227.79 และการปรับฐานลงอาจขยายไปยังแนวสนับสนุนของแนวโน้มระยะสั้นรายสัปดาห์ที่ 3164.81 การกำจัดจุดไขว้สีทองประจำวันที่ 3163.64 และการยืนต่ำกว่าแนวรายสัปดาห์ที่
สัปดาห์ที่แล้ว ตลาดได้ปรับปรุงระดับต่ำสุดใหม่ แต่ผู้ขายไม่สามารถทำให้การเคลื่อนไหวลงต่อไปได้อย่างเต็มที่ อาจเป็นเพราะระดับต่ำสุดของสัปดาห์ก่อนหน้านี้ (141.63) ได้รับการสนับสนุนเพิ่มเติมจากระดับสนับสนุนรายเดือน (141.96) ส่งผลให้การลดลงหยุดชะงัก และคู่สกุลเงินนี้เริ่มมีการปรับตัวขึ้น ในการปรับตัวขึ้นนี้ ฝ่ายซื้อสามารถกลับมาเรียกคืนการสนับสนุนจากแนวโน้มระยะสั้นในกรอบรายวัน ซึ่งปัจจุบันตั้งอยู่ที่ 141.97 และยังคงดันราคาขึ้นเรื่อยๆ เป้าหมายที่ใกล้ในตอนนี้
InstaForex
บัญชี PAMM

Your IP address shows that you are currently located in the USA. If you are a resident of the United States, you are prohibited from using the services of InstaFintech Group including online trading, online transfers, deposit/withdrawal of funds, etc.
If you think you are seeing this message by mistake and your location is not the US, kindly proceed to the website. Otherwise, you must leave the website in order to comply with government restrictions.
Why does your IP address show your location as the USA?
Please confirm whether you are a US resident or not by clicking the relevant button below. If you choose the wrong option, being a US resident, you will not be able to open an account with InstaTrade anyway.
We are sorry for any inconvenience caused by this message.

