อ่านรายละเอียดเพิ่มเติม


 18.10.2021 11:02 AM
Last week, the Japanese yen became one of the major currencies that showed a decline against the US dollar. At the same time, it should be noted that the dollar/yen currency pair showed rather impressive growth. Perhaps this is caused by the aggravated epidemiological situation in the world, where the fourth wave of COVID-19 is rampant. It is unknown how many more waves of this hated and annoying pandemic will be. However, during the exacerbation of COVID-19, it was the US dollar that investors preferred and still prefer as a protective asset. This factor likely caused the growth of the USD/JPY pair. However, since this review is devoted to the technical component, we proceed to analyze price charts, and let's start with a weekly scale.
Weekly
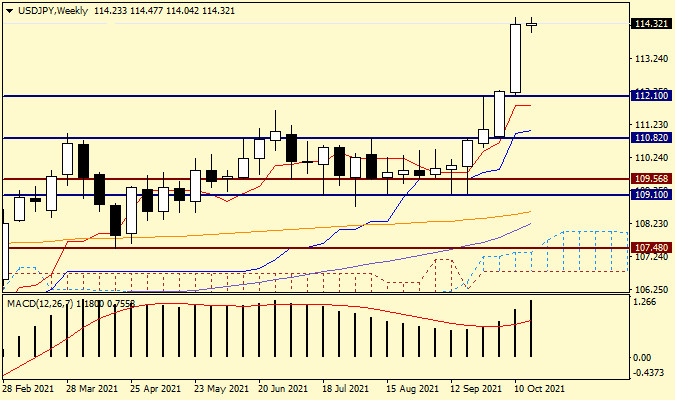
As a result of the impressive growth shown at the auction on October 11-15, a large bullish candle appeared on the weekly chart with a closing price of 114.26. Thus, the hated resistance of sellers in the area of 112.00-112.25 was more than confidently broken through. However, one should not discount another interesting and quite strong mark of 113.00. We may see a pullback to this significant level during the trading of the current five-day period. If this happens, then there will be a good option for buying a pair. However, it is incorrect to determine the points for entering the market using a weekly timeframe. In the absence of the expected pullback and continuation of the rise from current prices, another landmark psychological level of 115.00 looms on the horizon of buyers. The task of bears in the current situation looks extremely difficult. To take control of the pair, they will need to absorb the hefty last white candle and close the weekly trading below the level of 112.00. In my opinion, such a task is almost impossible, although, as we know, everything happens on the market and nothing is particularly surprising.
Daily
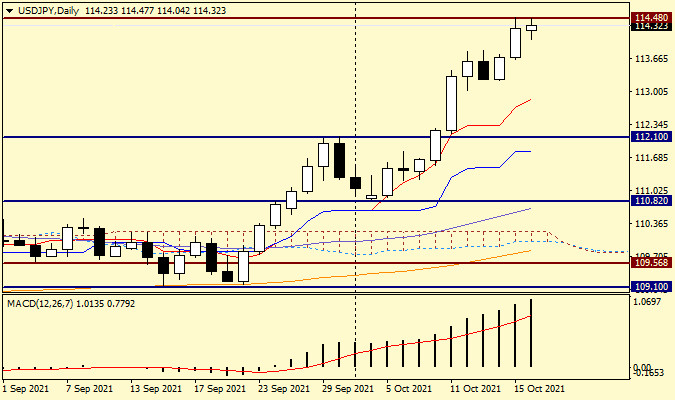
On this chart, all technical indicators turn up following the price, which can be characterized as support for growth and with a high probability of its continuation. The closest to the price (at 112.86) is the red Tenkan line of the Ichimoku indicator, so a pullback to Tenkan could be used to open long positions. However, given that the pair is currently trading near 114.28, such a deep pullback can be perceived as a change of course. As a more acceptable option for purchases, you can use a breakdown of the resistance of 114.48, fixing above this level and rolling back to it, after which you can try opening long positions. I am sure that this week we will return to the consideration of this currency pair. However, for now, I will outline the overall priority, which of course, comes down to purchases. Support levels: 114.00,113.40, and 113.00. Resistance passes at 114.60, 115.00, and 115.40. The general recommendation - we are looking for options to open purchases after corrective pullbacks, possibly to the designated support levels.
You have already liked this post today
*บทวิเคราะห์ในตลาดที่มีการโพสต์ตรงนี้ เพียงเพื่อทำให้คุณทราบถึงข้อมูล ไม่ได้เป็นการเจาะจงถึงขั้นตอนให้คุณทำการซื้อขายตาม
ลิงก์ที่เป็นประโยชน์: บทความอื่นๆ ของฉันสามารถอ่านได้ในส่วนนี้ คอร์สพื้นฐาน InstaForex สำหรับผู้เริ่มต้น การวิเคราะห์ยอดนิยม เปิดบัญชีซื้อขาย สำคัญ: สำหรับผู้เริ่มต้นในการเทรดฟอเร็กซ์ ควรระมัดระวังเป็นพิเศษเมื่อทำการตัดสินใจเกี่ยวกับการเข้าสู่ตลาด ก่อนที่รายงานสำคัญจะออก ควรหลีกเลี่ยงการเข้าตลาดเพื่อป้องกันการถูกกระทบจากความผันผวนของตลาดที่เพิ่มขึ้น หากตัดสินใจเทรดในช่วงที่มีการประกาศข่าว ควรตั้ง
หากเราพิจารณากราฟ 4 ชั่วโมงของคู่สกุลเงิน GBP/CHF จะพบข้อเท็จจริงที่น่าสนใจหลายประการ ประการแรก การปรากฏตัวของรูปแบบ Triangle ตามด้วยการเคลื่อนไหวของ EMA (21) ที่เคลื่อนที่ระหว่างตัวแท่งเทียนบ่งชี้ว่าสถานการณ์ปัจจุบันของ GBP/CHF กำลังเคลื่อนที่ในลักษณะ Sideways
ด้วยการเคลื่อนไหวของราคาคู่เงินตรา AUD/CAD ที่เคลื่อนขึ้นเหนือเส้น WMA (21) ที่มีความชันไปทางขาขึ้น และการปรากฏของสัญญาณการบรรจบกันระหว่างการเคลื่อนไหวของราคา AUD/CAD กับตัวบ่งชี้ Stochastic Oscillator นั้นแสดงให้เห็นว่ามีโอกาสที่ในอนาคตอันใกล้จะแข็งค่าขึ้นไปถึงระดับ 0.8896 หากสามารถทะลุระดับนี้ไปได้และปิดสูงกว่า ก็จะทำให้
ในช่วงต้นของการซื้อขายในสหรัฐอเมริกา ทองคำกำลังเคลื่อนที่ในทางขาขึ้นอย่างแข็งแรงหลังวันหยุดอีสเตอร์ ถึงระดับสูงสุดตลอดกาลใหม่ที่ประมาณ 3,406 ทางเทคนิคแล้ว ทองคำมีศักยภาพในการขึ้นไปได้สูง และมีแนวโน้มที่จะถึงจุดสูงสุดในแนวโน้มขาขึ้นระหว่าง 3,422 และ 3,430 บริเวณนี้เป็นจุดสำคัญเนื่องจากทองคำอาจเจอแรงต่อต้านรุนแรง ซึ่งอาจถือเป็นโอกาสในการขาย อย่างไรก็ตาม เราเชื่อว่าทองคำอาจกลับไปที่ระดับ 3,330
จากที่เห็นในกราฟ 4 ชั่วโมง คู่สกุลเงิน EUR/GBP ดูเหมือนจะเคลื่อนไหวเหนือเส้น EMA (100) ซึ่งบ่งบอกว่าผู้ซื้อมีอิทธิพลเหนือคู่สกุลเงินนี้ ดังนั้นในอนาคตอันใกล้ ตราบใดที่ไม่มีการแก้ไขที่อ่อนแอที่ทะลุและปิดต่ำกว่าระดับ 0.8521 EUR/GBP มีโอกาสที่จะคุ้มค่าและเพิ่มขึ้นถึงระดับ 0.8613
จากการเกิดการบรรจบกันระหว่างการเคลื่อนไหวของราคาของคู่สกุลเงินหลัก USD/JPY กับตัวชี้วัด Stochastic Oscillator และตำแหน่งของ EMA (100) ที่อยู่เหนือราคานั้น ในอนาคตอันใกล้นี้ USD/JPY มีแนวโน้มที่จะอ่อนค่าลงต่อไป โดยตราบใดที่ยังไม่มีการเสริมกำลังเพิ่มเติมที่ฝ่าและปิดเหนือระดับ 149.43 USD/JPY
ลิงก์ที่เป็นประโยชน์: บทความอื่น ๆ ของฉันสามารถอ่านได้ในส่วนนี้ คอร์สเริ่มต้น InstaForex สำหรับผู้เริ่มต้น การวิเคราะห์ที่ได้รับความนิยม เปิดบัญชีซื้อขาย สำคัญ: ผู้เริ่มต้นในตลาดฟอเร็กซ์ต้องระมัดระวังอย่างมากในการตัดสินใจเข้าสู่ตลาด ก่อนที่รายงานสำคัญจะถูกปล่อยออกมา คุณควรออกจากตลาดก่อน เพื่อหลีกเลี่ยงผลกระทบของความผันผวนที่เพิ่มขึ้น หากคุณตัดสินใจทำการซื้อขายในขณะนี้
ราคาทองคำยังคงได้รับแรงสนับสนุนท่ามกลางความไม่แน่นอนเกี่ยวกับเส้นทางในอนาคตของสงครามภาษีที่ริเริ่มโดย Donald Trump ราคาทองคำได้พุ่งสูงขึ้นอย่างต่อเนื่องเป็นเวลากว่า 4 เดือน โดยปัจจัยหลักคือความหวาดกลัวที่เพิ่มขึ้นว่าศักยภาพทางเศรษฐกิจโลกอาจพังทลายลงภายใต้ความตึงเครียดที่เพิ่มขึ้น—โดยเฉพาะการเผชิญหน้าระหว่างปักกิ่งและวอชิงตัน ในเชิงเทคนิคแล้ว ราคาของโลหะมีค่านี้มีการซื้อมากเกินไปและอาจพังทลายลงได้ทุกเมื่อหากมีข่าวเกี่ยวกับข้อตกลงทางการค้าระหว่างสหรัฐฯ และจีนปรากฏออกมา แม้ยังไม่มีจุดจบที่ชัดเจนสำหรับการเผชิญหน้านี้ แต่เมื่อพิจารณาจากท่าทีที่เด็ดเดี่ยวของปักกิ่ง การเดินเกมของ Trump และความเสี่ยงทางเศรษฐกิจที่แท้จริง—โดยเฉพาะในสหรัฐฯ—จึงถือเป็นเรื่องสมเหตุสมผลที่จะคาดหวังว่าการเจรจาระหว่างทั้งสองประเทศจะเริ่มขึ้นในที่สุด
เมื่อวันพุธที่ผ่านมา ยูโรเคลื่อนเข้าสู่ช่วงเป้าหมายที่ 1.1385–1.1420 อีกครั้ง แต่พฤติกรรมการเคลื่อนไหวของราคาเมื่อไม่นานมานี้ชี้ให้เห็นว่าระดับ 1.1385 อาจจะไม่สำคัญแล้ว — เรากำลังเห็นช่วงการเคลื่อนไหวระหว่าง 1.1276 ถึง 1.1420 ภายในช่วงนี้ ยูโรจะรอติดตามผลการประชุม
สมาชิกInstaForex

Your IP address shows that you are currently located in the USA. If you are a resident of the United States, you are prohibited from using the services of InstaFintech Group including online trading, online transfers, deposit/withdrawal of funds, etc.
If you think you are seeing this message by mistake and your location is not the US, kindly proceed to the website. Otherwise, you must leave the website in order to comply with government restrictions.
Why does your IP address show your location as the USA?
Please confirm whether you are a US resident or not by clicking the relevant button below. If you choose the wrong option, being a US resident, you will not be able to open an account with InstaTrade anyway.
We are sorry for any inconvenience caused by this message.


