Vea también


 01.04.2024 02:47 PM
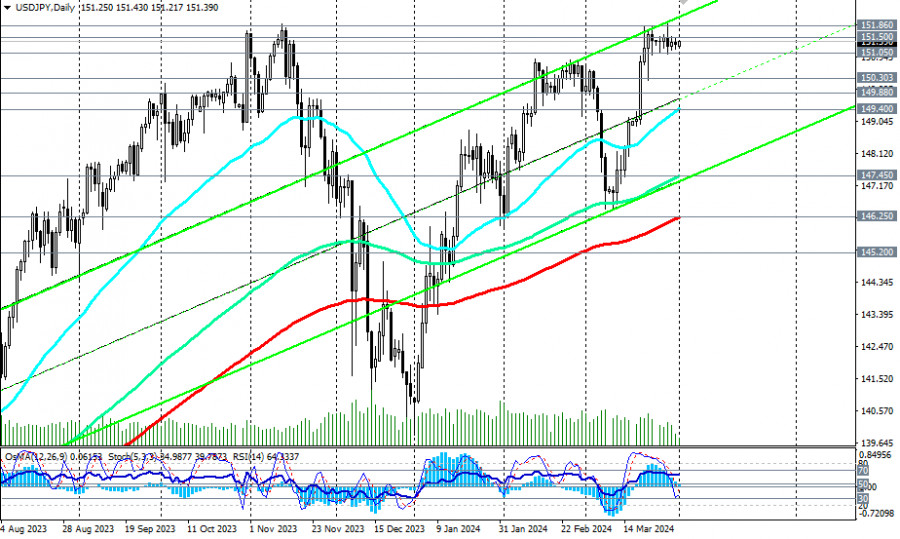
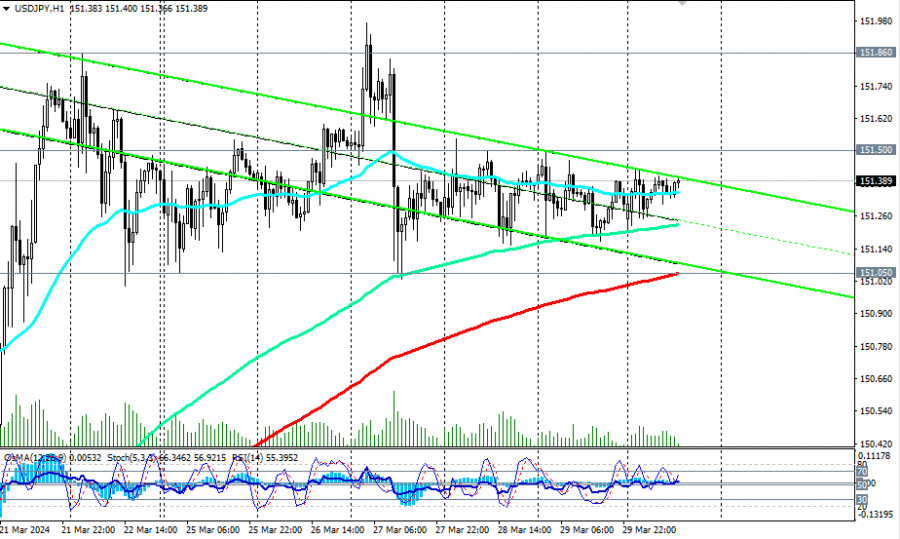
Despite the ongoing trend of the strengthening dollar, USD/JPY has remained within a narrow range near the 151.50 mark for the 8th consecutive trading day, fluctuating between the levels of 151.05 and 151.85. Investors are wary of possible currency intervention by the Japanese monetary authorities.
However, if the important macroeconomic data expected from the U.S. this week exceeds forecasts, indicating the strength of the American economy and labor market, then bulls, despite the threat of currency intervention, may attempt to break the recent local high of 151.86 and push USD/JPY to new record highs.
In this case, a breakthrough above the 151.50 mark may serve as the first signal for new long positions on USD/JPY, with the 151.86 level serving as confirmation.
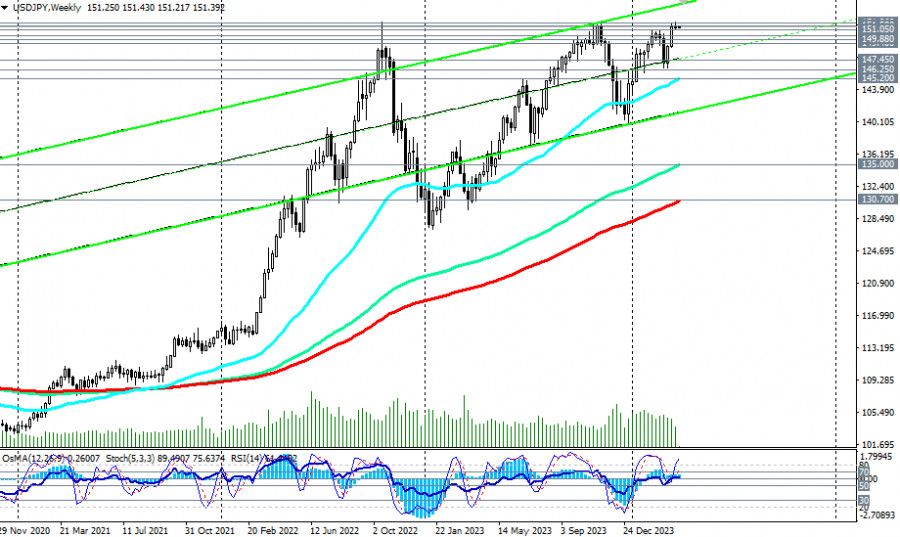
Nevertheless, USD/JPY continues to trade in the bullish market zone, medium-term—above the key support level of 146.25 (200 EMA on the daily chart), and long-term—above the key support level of 130.70 (200 EMA on the weekly chart), which, from a technical standpoint, makes long positions preferable.
In an alternative scenario, a breakthrough of the important short-term support level of 151.05 (200 EMA on the 1-hour chart) may signal the beginning of a downward correction.
In the conditions of a stable bullish trend, the downward correction will most likely be limited by support levels at 150.30, 150.00, 149.88 (200 EMA on the 4-hour chart), 149.40 (50 EMA on the daily chart).
Only a breakthrough of the key support level of 146.25 (200 EMA on the daily chart) could lead the price into the medium-term bearish market zone, making short positions preferable.
For now, the advantage remains with long positions.
Support levels: 151.05, 151.00, 150.30, 150.00, 149.88, 149.40, 149.00, 148.00, 147.45, 147.00, 146.25, 146.00, 145.20, 145.00
Resistance levels: 151.50, 151.85, 152.00, 153.00
Trading Scenarios
Main Scenario
Aggressive: Buy at the market, Buy Stop 151.90. Stop Loss 150.80
Moderate: Buy Stop 152.10. Stop Loss 150.90
Targets: 153.00, 154.00, 155.00
Alternative Scenario
Aggressive: Sell Stop 150.90. Stop Loss 151.60
Moderate: Sell Stop 150.20. Stop Loss 151.10
Targets: 150.00, 149.88, 149.40, 149.00, 148.00, 147.45, 147.00, 146.25, 146.00, 145.20, 145.00
"Targets" correspond to support/resistance levels. This also does not mean that they will necessarily be reached, but they can serve as a guide when planning and placing your trading positions.
You have already liked this post today
*El análisis de mercado publicado aquí tiene la finalidad de incrementar su conocimiento, más no darle instrucciones para realizar una operación.
Ayer se formaron varios puntos de entrada al mercado. Veamos el gráfico de 5 minutos y analicemos lo que ocurrió allí. En mi pronóstico matutino presté atención al nivel 1.3282
Ayer se formaron varios puntos de entrada al mercado. Veamos el gráfico de 5 minutos y analicemos lo que ocurrió allí. En mi pronóstico matutino presté atención al nivel 1.1320
GBP/USD: plan para la sesión europea del 30 de abril. Informes Commitment of Traders COT (análisis de las operaciones de ayer). La libra se prepara para un nuevo salto, pero
Ayer se formó solo un punto de entrada al mercado. Veamos el gráfico de 5 minutos y analicemos lo que sucedió allí. En mi pronóstico de a mañana presté atención
Ayer se formaron varios puntos de entrada al mercado. Veamos el gráfico de 5 minutos y analicemos lo que ocurrió. En mi pronóstico matutino presté atención al nivel de 1.3342
Ayer no se formaron puntos de entrada al mercado. Propongo echar un vistazo al gráfico de 5 minutos y analizar lo que ocurrió. En mi pronóstico matutino, presté atención
GBP/USD: plan para la sesión europea del 28 de abril. Informes Commitment of Traders COT (análisis de las operaciones de ayer). La libra formó un nuevo canal, manteniendo las posibilidades
El pasado viernes no se formaron puntos de entrada al mercado. Veamos el gráfico de 5 minutos y analicemos qué ocurrió. En mi pronóstico matutino presté atención al nivel 1.1391
Ayer se formaron varios puntos excelentes de entrada al mercado. Veamos el gráfico de 5 minutos y analicemos lo que ocurrió. En mi pronóstico matutino presté atención al nivel
Ayer no se formaron puntos de entrada al mercado. Veamos el gráfico de 5 minutos y analicemos qué pasó allí. En mi pronóstico matutino presté atención al nivel de 1.1358
Gráfico Forex
versión web

Your IP address shows that you are currently located in the USA. If you are a resident of the United States, you are prohibited from using the services of InstaFintech Group including online trading, online transfers, deposit/withdrawal of funds, etc.
If you think you are seeing this message by mistake and your location is not the US, kindly proceed to the website. Otherwise, you must leave the website in order to comply with government restrictions.
Why does your IP address show your location as the USA?
Please confirm whether you are a US resident or not by clicking the relevant button below. If you choose the wrong option, being a US resident, you will not be able to open an account with InstaTrade anyway.
We are sorry for any inconvenience caused by this message.


