Veja também


 26.03.2025 05:26 AM
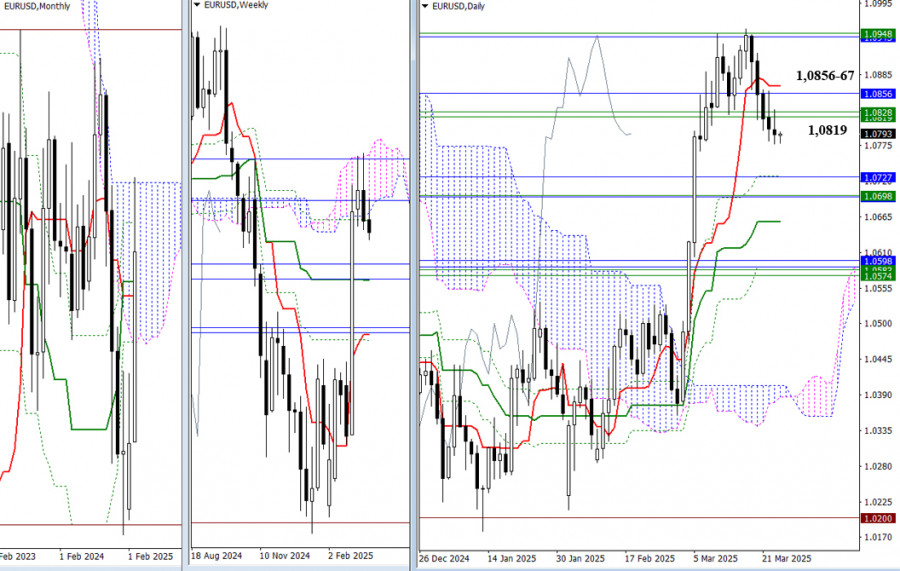
As the week begins, bearish players are trying to confirm and extend the prevailing downtrend, but they have yet to achieve strong results — The pair continues to stay close to the weekly levels. (1.0819 – 1.0828). If the decline does progress, the nearest target and next support zone for today lies at 1.0727 – 1.0698 (monthly Tenkan and Kijun lines + the weekly medium-term trend). If bears lack the strength to push lower and their opponents seize the initiative, the bulls' first step will be to reclaim the levels 1.0819 – 1.0856 – 1.0867 and consolidate above them.
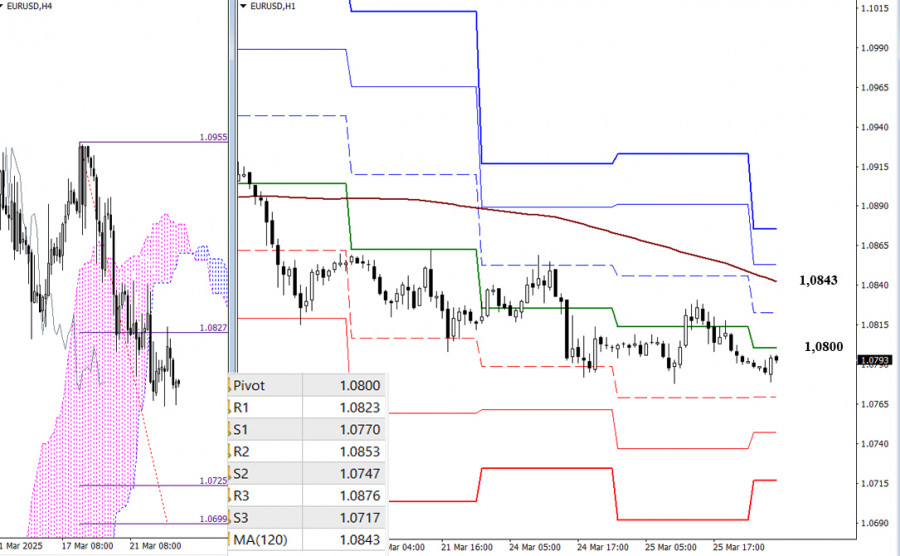
On the lower timeframes, bearish players are currently developing a downward trend. Their targets today include support from the classic Pivot levels (1.0770 – 1.0747 – 1.0717) and the breakout zone of the H4 Ichimoku cloud (1.0725 – 1.0699). If an upward correction develops, the market may encounter resistance near 1.0800 – 1.0823. However, the key level for the bulls will be testing and breaking through the weekly long-term trend line (1.0843). A breakout and reversal of the trend could shift the balance of power in favor of strengthening bullish sentiment. Additional intraday upside targets may include 1.0853 – 1.0876 (classic Pivot resistance levels).
***
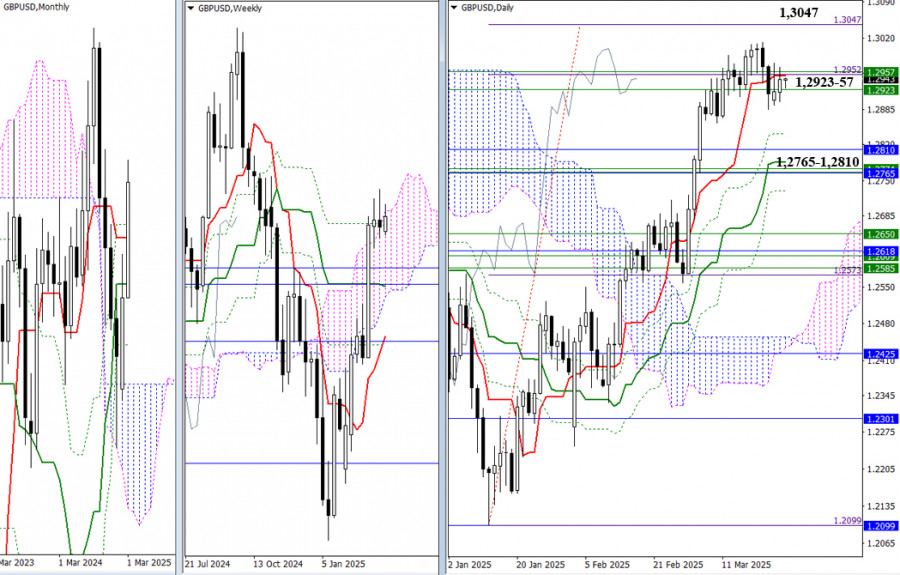
Uncertainty persists. The pound remains closely linked to its weekly levels (1.2923 – 1.2957) and the daily short-term trend line (1.2950). All other key levels have also remained in place. The nearest bullish target is the complete achievement of the daily cloud breakout goal at 100% (1.3047), while bearish targets are still clustered around support from multiple timeframes, led by the monthly support zone at 1.2765 – 1.2810.
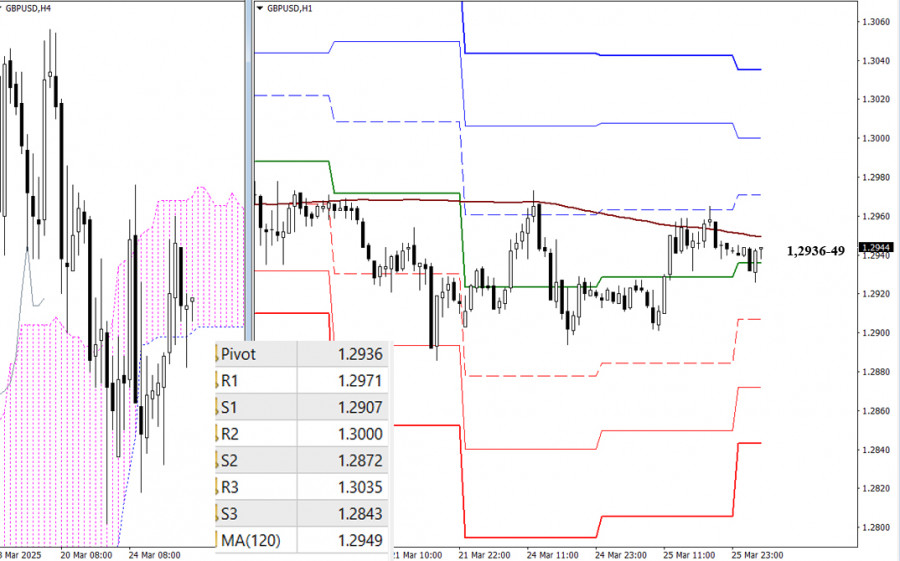
On the lower timeframes, the market is currently testing the key levels at 1.2936 (central Pivot level) and 1.2949 (weekly long-term trend). A breakout and consolidation above these levels would help bulls shift the balance of power and gain a stronger advantage. A rejection would create an opportunity for further declines. Today's bearish intraday trend targets include the classic Pivot supports at 1.2907 – 1.2872 – 1.2843.
***
You have already liked this post today
*A análise de mercado aqui postada destina-se a aumentar o seu conhecimento, mas não dar instruções para fazer uma negociação.
No gráfico de 4 horas do índice Nasdaq 100, o Oscilador Estocástico apresenta sinal de venda por cruzamento, enquanto se forma um padrão de cunha ascendente — uma configuração geralmente
No início da sessão americana, o par EUR/USD está sendo negociado próximo de 1,1378, dentro de um canal de tendência de baixa formado em 17 de abril, e começa
No início da sessão americana, o ouro está sendo negociado próximo a 3.384, acima do suporte principal e se recuperando após atingir 3.267. A expectativa é que o ouro recupere
Com o surgimento dos padrões de Divergência e de Cunha Descendente Ampliada no gráfico de 4 horas do par AUD/JPY, ainda que o movimento de preços esteja abaixo da Média
No gráfico de 4 horas do par USD/JPY, observa-se que o indicador Oscilador Estocástico forma um padrão de Fundo Duplo, enquanto a ação do preço apresenta uma máxima mais alta
No início da sessão americana, o ouro está sendo negociado próximo do nível de US$ 3.310, região onde se encontra a média móvel simples de 21 períodos (SMA 21)
Nosso plano de negociação para as próximas horas prevê vendas abaixo de 1,1410, visndo chegar em 1,1370 e 1,1230. O indicador Eagle sinaliza uma possível reversão, reforçando nossa expectativa
Por outro lado, se a pressão de baixa prevalecer e o euro se consolidar abaixo de 1,1370, isso pode ser interpretado como um sinal de venda, com alvos no nível
O indicador Eagle está mostrando sinais de sobrevenda, portanto, acreditamos que o ouro poderia retomar seu ciclo de alta no curto prazo após uma correção técnica e atingir o nível
Contas PAMM
da InstaForex

Your IP address shows that you are currently located in the USA. If you are a resident of the United States, you are prohibited from using the services of InstaFintech Group including online trading, online transfers, deposit/withdrawal of funds, etc.
If you think you are seeing this message by mistake and your location is not the US, kindly proceed to the website. Otherwise, you must leave the website in order to comply with government restrictions.
Why does your IP address show your location as the USA?
Please confirm whether you are a US resident or not by clicking the relevant button below. If you choose the wrong option, being a US resident, you will not be able to open an account with InstaTrade anyway.
We are sorry for any inconvenience caused by this message.


