Veja também


 21.03.2025 07:25 AM
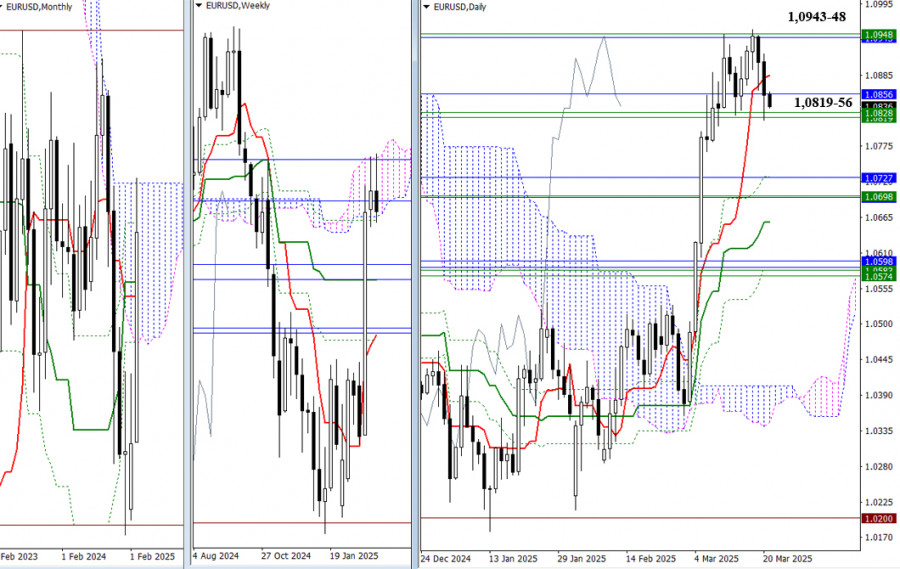
The pair failed to break through the resistance levels of the weekly (1.0948) and monthly (1.0943) Ichimoku clouds, retreating to the support cluster zone across multiple timeframes (1.0819–1.0856). As we wrap up the trading week today, a break and consolidation below this support zone would form a rejection signal on the weekly timeframe. In that case, the bears' next steps would involve confirming and extending the downward movement, with the following support levels in the 1.0696–1.0727 range. If the pair fails to move below 1.0819–1.0856, a pause or consolidation is likely. After that, the market may once again test the Ichimoku cloud boundaries (1.0948–1.0943) in an attempt to break into and stay in bullish territory.
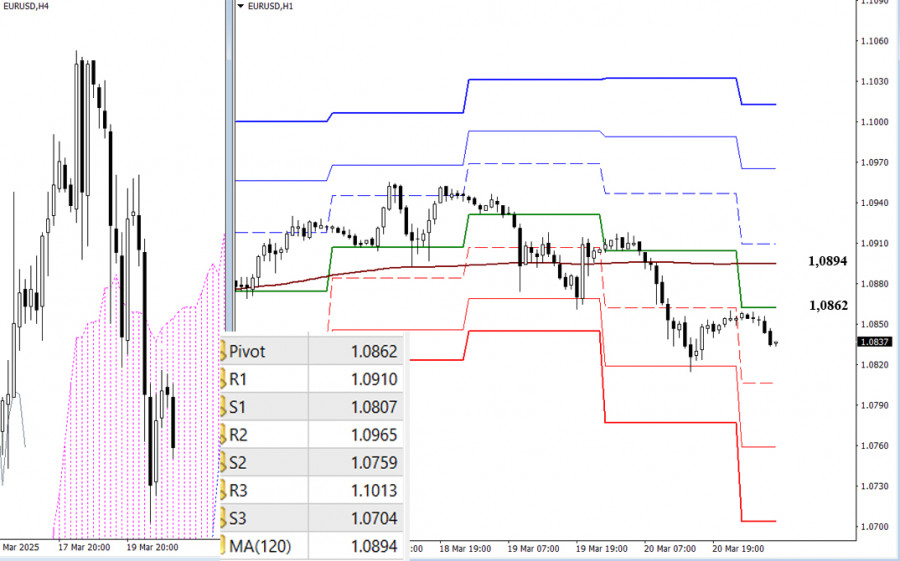
On the lower timeframes, bears have the upper hand. Today's potential for further downside lies through the classic Pivot support levels: 1.0807 – 1.0759 – 1.0704.
Key levels whose breakout could shift the current balance of power are:
If bullish momentum returns, a break above the weekly trend line will reverse its slope. The next upside targets for bulls would be the classic Pivot resistance levels: 1.0910 – 1.0965 – 1.1013.
***
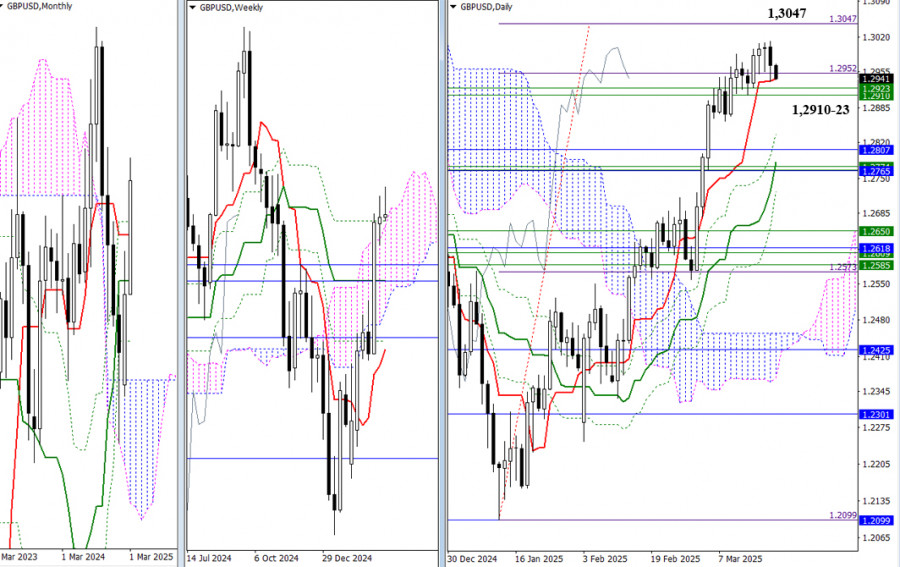
Throughout the current week, bulls managed to update last week's high but achieved no further progress. Instead, they are entering a consolidation phase, using the daily short-term trend line at 1.2941 as support. As a result, previous conclusions and expectations remain valid. The key target for bulls continues to be the 100% Fibonacci projection level at 1.3047, while the nearest bearish plan involves a break below the weekly support levels at 1.2910–1.2923.
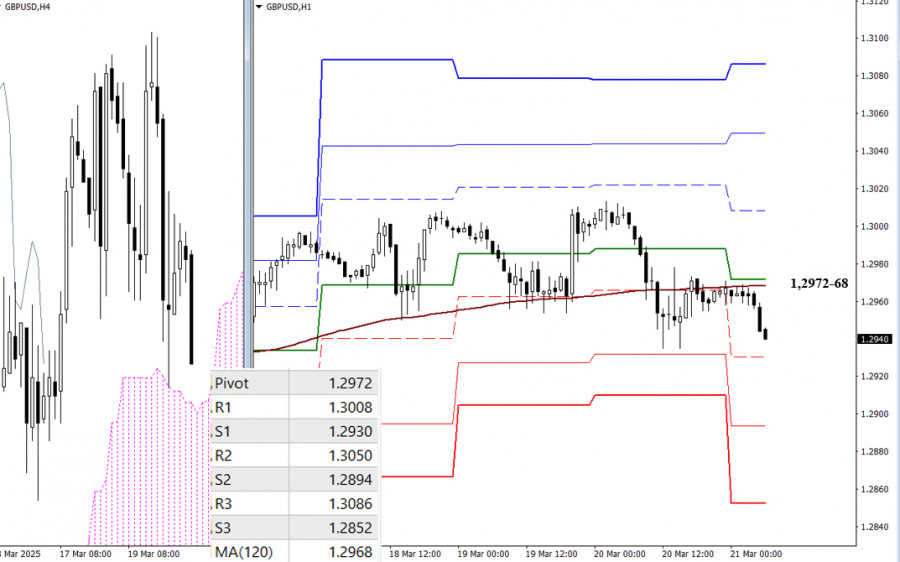
On the lower timeframes, sellers have consolidated below key levels, giving them a technical advantage. To push further downward today, bears will aim to break the classic Pivot supports: 1.2930 – 1.2894 – 1.2852. To reverse the situation, bulls would need to break and hold above the key zone at 1.2972–1.2968 (daily central Pivot + weekly long-term trend), thereby reversing the trend. Continuation of the upward move would require pushing through the Pivot resistance levels: 1.3008 – 1.3050 – 1.3086.
***
You have already liked this post today
*A análise de mercado aqui postada destina-se a aumentar o seu conhecimento, mas não dar instruções para fazer uma negociação.
No início da sessão europeia, o par EUR/USD está sendo negociado próximo de 1,1224, acima da média móvel exponencial de 200 períodos (EMA 200), mas ainda abaixo do nível 6/8
Por outro lado, se a pressão vendedora prevalecer, o ouro pode voltar a cair e testar novamente o nível 6/8 de Murray, que funcionaria como um suporte técnico importante
No gráfico de 4 horas do principal par de moedas, o USD/JPY, embora apresente sinais de fortalecimento — evidenciado pelo movimento de preços acima da média móvel exponencial
Com a formação de uma divergência entre o movimento de preços do índice Nasdaq 100 e o indicador Oscilador Estocástico — enquanto o preço se mantém acima da média móvel
 InstaFutures
Make money with a new promising instrument!
InstaForex em números

Your IP address shows that you are currently located in the USA. If you are a resident of the United States, you are prohibited from using the services of InstaFintech Group including online trading, online transfers, deposit/withdrawal of funds, etc.
If you think you are seeing this message by mistake and your location is not the US, kindly proceed to the website. Otherwise, you must leave the website in order to comply with government restrictions.
Why does your IP address show your location as the USA?
Please confirm whether you are a US resident or not by clicking the relevant button below. If you choose the wrong option, being a US resident, you will not be able to open an account with InstaTrade anyway.
We are sorry for any inconvenience caused by this message.


