Veja também


 09.12.2024 12:41 AM
Throughout the past week, gold traded within a narrow range inside the daily Ichimoku cloud. The primary resistances limiting its movement were the weekly short-term trend at 2662.95 and the daily medium-term trend at 2662.83. Bullish players must surpass the weekly Tenkan level (2662.95) and neutralize the daily Ichimoku cross to extend the upward trend. The levels of the cross are currently at 2635.38, 2649.00, and 2675.60. Beyond that, it will be critical to exit the daily cloud at 2722.58. If the bulls overcome these resistances, their next objectives will include breaking the last significant high at 2789.61 and testing the critical psychological level of 2800.00.
Should the uncertainty of the past week resolve in favor of the bears, breaking into the bearish zone below the daily cloud (2630.50) will establish a downward target to breach the cloud. To achieve the daily target, bearish players must test and overcome weekly supports at 2598.24, 2537.92, and 2478.56, further reinforced by the monthly short-term trend at 2509.30.
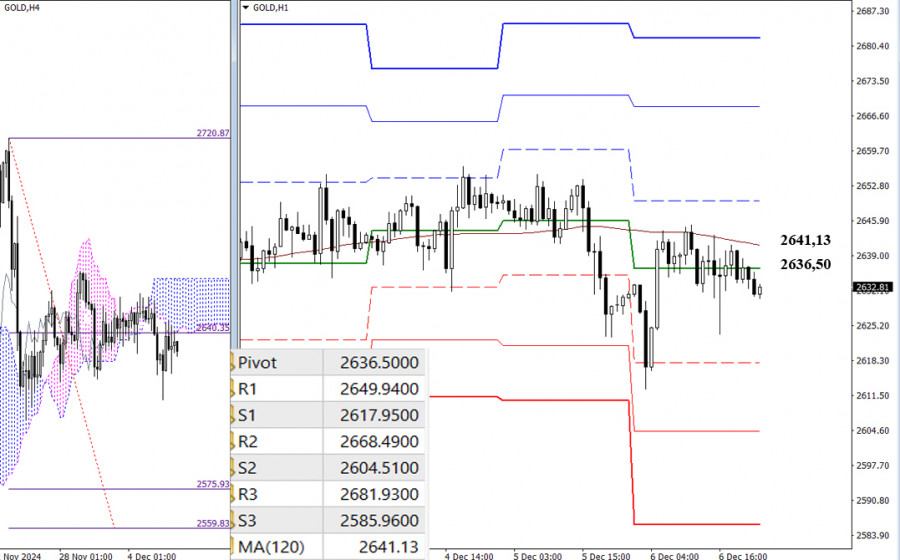
Uncertainty is also evident in the lower timeframes. The pair has been trading near the gravitational zone of key levels, which, on the last trading day of the week, were positioned at 2636.50 and 2641.13 (central Pivot level + weekly long-term trend).
If the current indecision ends with bearish activity, the downward targets will include the supports of the classic Pivot levels, complemented by the objective of breaking through the H4 cloud at 2575.93 – 2559.83. Conversely, if the bulls take the initiative, their intraday targets include classic Pivot levels. Additionally, solid consolidation in the bullish zone above the H4 cloud will establish an upward target to break the H4 cloud. The values of the classic Pivot levels are updated daily, with new data available at the start of trading.
***
You have already liked this post today
*A análise de mercado aqui postada destina-se a aumentar o seu conhecimento, mas não dar instruções para fazer uma negociação.
Com base na análise do gráfico de 4 horas do índice Nasdaq 100, destacam-se três pontos principais: primeiro, o movimento dos preços ocorre abaixo da média móvel de 100 períodos
Os preços do ouro continuam sustentados pela névoa de incertezas que cerca o desdobramento das guerras tarifárias iniciadas por Donald Trump. O metal precioso vem apresentando uma valorização quase vertical
O indicador Eagle está atingindo uma sobrecompra extrema. Portanto, nos níveis de preço atuais, abaixo de sua maior alta de todos os tempos, será possível vender visando chegar a 3.281
No gráfico de 4 horas, o par de moedas USD/CAD (moeda de commodities) apresenta movimentação abaixo da média móvel exponencial de 100 períodos (EMA 100), com a formação
Com o Oscilador Estocástico se aproximando da zona de sobrevenda (nível 20) no gráfico de 4 horas do par cruzado AUD/JPY, existe potencial de enfraquecimento de curto prazo
Ferrari F8 TRIBUTO
da InstaForex
Notificações por
E-mail/SMS

Your IP address shows that you are currently located in the USA. If you are a resident of the United States, you are prohibited from using the services of InstaFintech Group including online trading, online transfers, deposit/withdrawal of funds, etc.
If you think you are seeing this message by mistake and your location is not the US, kindly proceed to the website. Otherwise, you must leave the website in order to comply with government restrictions.
Why does your IP address show your location as the USA?
Please confirm whether you are a US resident or not by clicking the relevant button below. If you choose the wrong option, being a US resident, you will not be able to open an account with InstaTrade anyway.
We are sorry for any inconvenience caused by this message.


