Veja também

 26.09.2024 06:17 AM
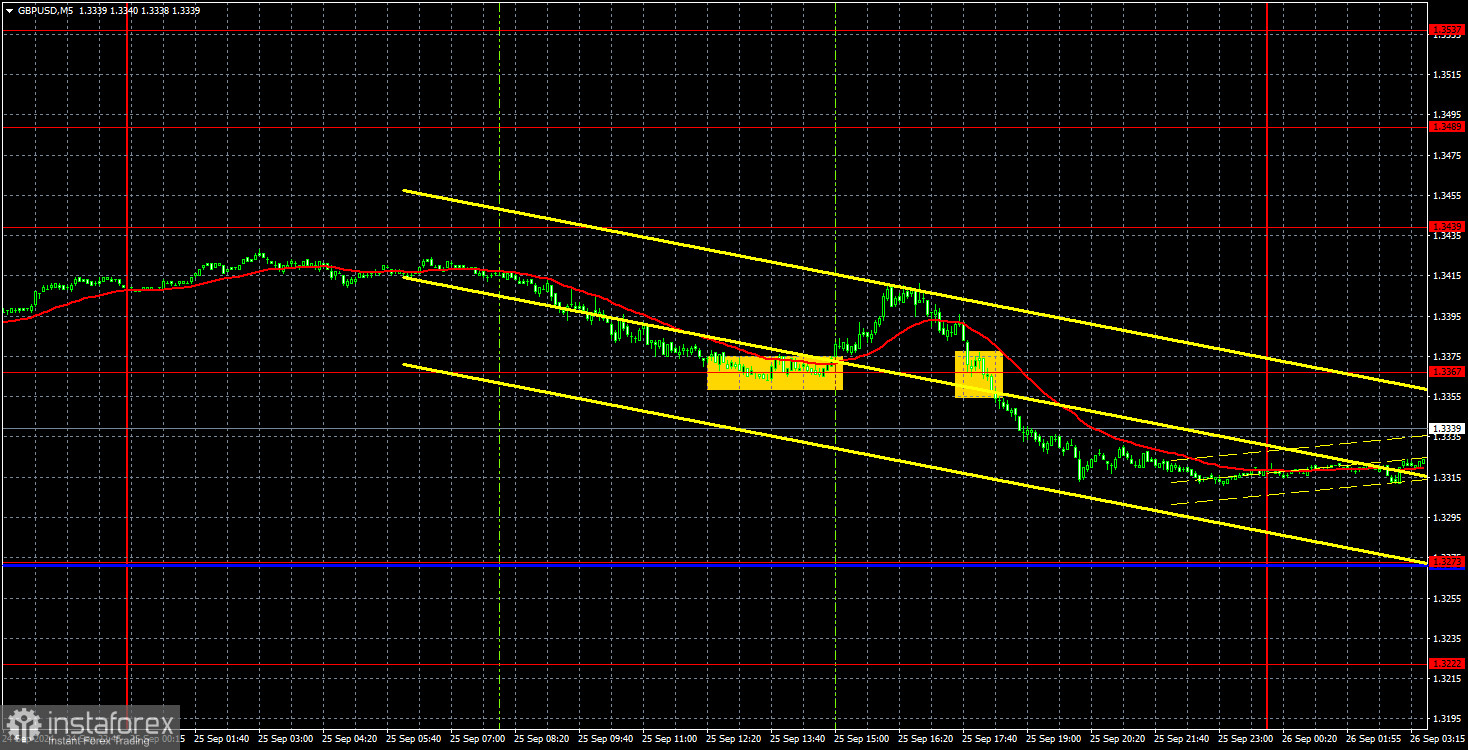
The GBP/USD pair fell by 100 pips on Wednesday, which might lead some to think we're being unfair. Indeed, the pound sterling fell by 1 cent in less than a day, seemingly out of nowhere! However, we'd like to point out that this drop doesn't affect the bigger picture. If the pound rises by 300 pips and falls by 100, that's called a strong uptrend with a weak correction. There would be no questions about whether the British currency had genuine reasons for the consistent growth that's been happening for several months. However, the market has been reacting to the Federal Reserve's monetary easing since early 2024 (if not since September 2022) and continues to do so. The pound sterling has already risen by 3,000 pips despite no significant positive changes in the British economy. Yesterday, the macroeconomic and fundamental background was absent.
From a technical standpoint, the pair maintains an uptrend even on the hourly time frame. For the dollar to have at least some chance of growth, it needs to consolidate below the trendline. In this case, the price could continue to fall towards the Senkou Span B line, which is moving upward more than the price itself is moving downward. However, any macroeconomic report on the labor market, business activity, or unemployment from the US could trigger another collapse of the US dollar. The market expects a further 0.5% rate cut at the next Fed meeting, even though the September meeting just occurred.
On Wednesday, two trading signals were formed in the 5-minute time frame. First, the pair bounced off the 1.3367 level, allowing traders to open long positions. However, the price managed to move up only 28 pips. There couldn't have been any loss in the long position. Then, the price consolidated below the 1.3367 level and moved down about 40 pips by the end of the day. Traders could have earned these 40 pips.
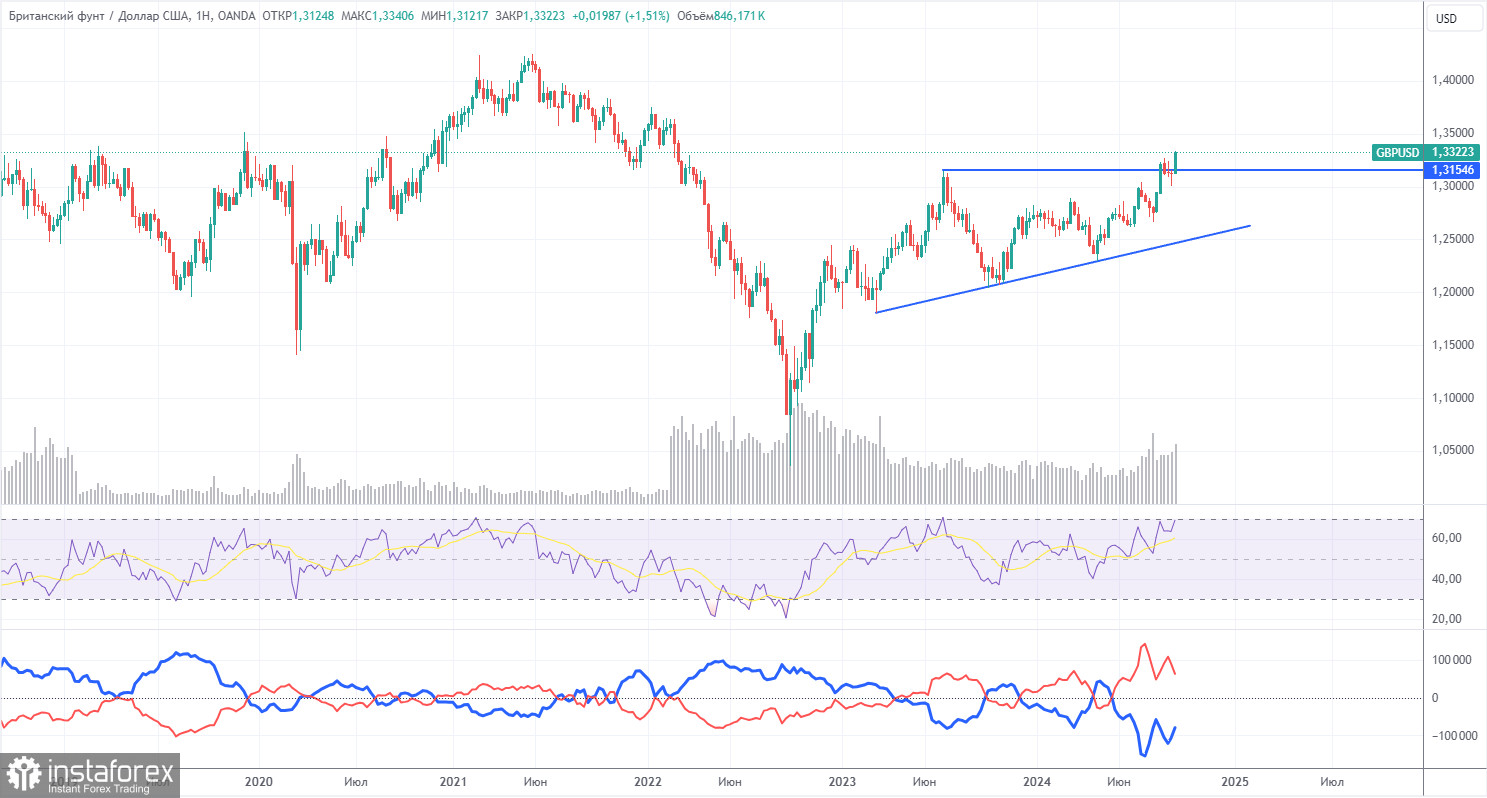
COT reports on the British pound show that commercial traders' sentiment has been constantly changing in recent years. The red and blue lines, which represent the net positions of commercial and non-commercial traders, constantly intersect and, in most cases, remain close to the zero mark. We also see that the last phase of the downward trend occurred when the red line was below the zero mark. The red line is above 0, and the price has broken through the significant level of 1.3154.
According to the latest COT report on the British pound, the non-commercial group closed 17,200 buy contracts and opened 10,000 sell contracts. As a result, the net position of non-commercial traders decreased by 27,200 contracts over the week. Nevertheless, the pound sterling has still appreciated.
The fundamental background still does not justify long-term purchases of the pound sterling, and the currency itself has a real chance of resuming the global downward trend. However, on the weekly timeframe, we have an ascending trendline, so until it is broken, a long-term decline in the pound is unlikely. The pound sterling continues to rise despite almost everything, and even when COT reports show that major players are selling the pound, it still grows.
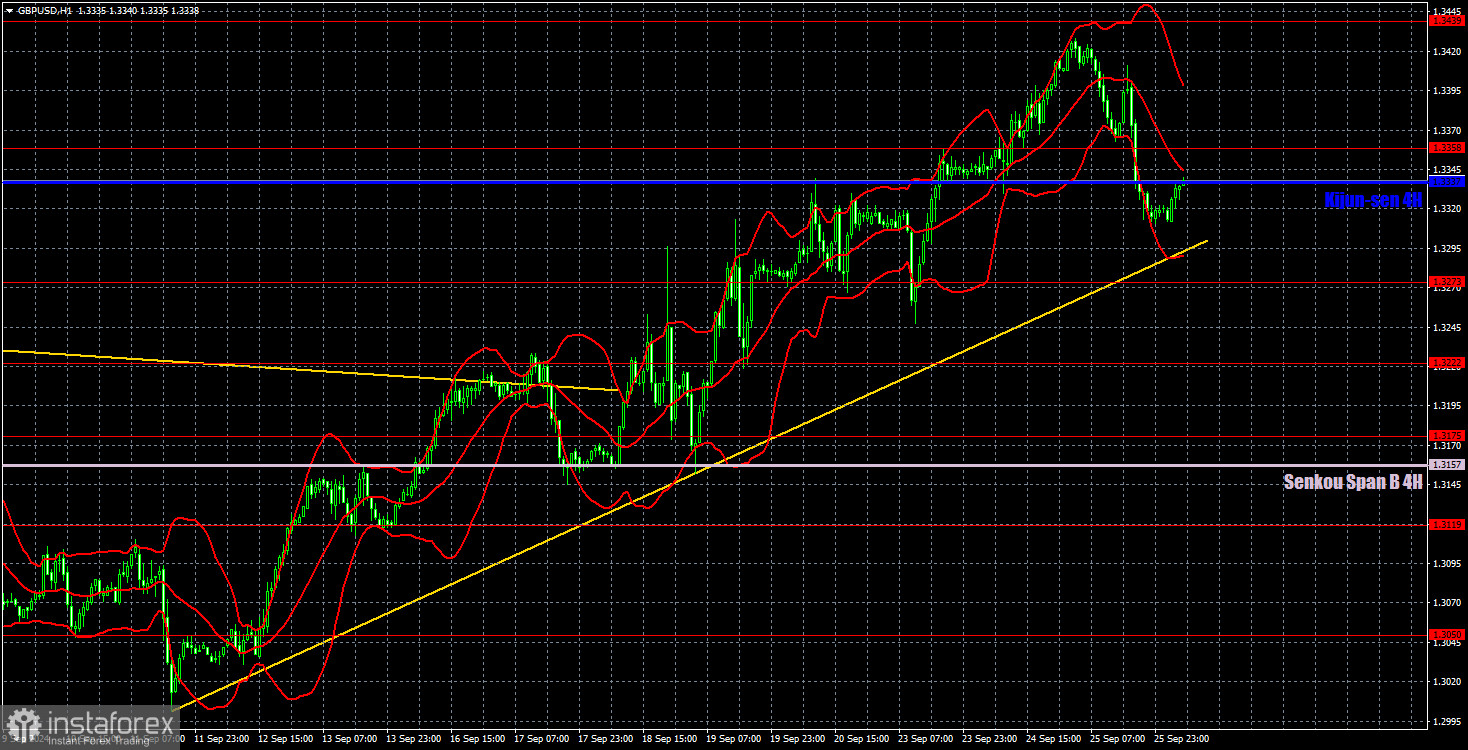
The GBP/USD pair has resumed and continues its upward movement in the hourly time frame. However, we still can't recommend buying the pound. The illogical upward trend of the British currency might continue for some time, even though the pair is once again very overbought. On Monday, the reasons for a decline in the British pound were much more substantial than for an increase, but instead, we saw another rise to the north. On Tuesday, there were no reasons at all. On Wednesday, the price corrected, but this correction doesn't change anything.
For September 26, we highlight the following important levels: 1.2796-1.2816, 1.2863, 1.2981-1.2987, 1.3050, 1.3119, 1.3175, 1.3222, 1.3273, 1.3367, and 1.3439. The Senkou Span B (1.3157) and Kijun-sen (1.3337) lines can also serve as signal sources. It's recommended to place the Stop Loss at break even once the price moves 20 pips in the intended direction. The Ichimoku indicator lines may move throughout the day, which should be considered when determining trading signals.
There are no important events scheduled for Thursday in the UK, but in the US, Jerome Powell's speech is expected, along with important reports on GDP and durable goods orders. Volatility has noticeably increased recently, and trading is possible, at least in smaller time frames.
Support and resistance price levels: thick red lines, where the movement may end. They are not sources of trading signals.
Kijun-sen and Senkou Span B lines: lines of the Ichimoku indicator transferred to the hourly time frame from the 4-hour one. They are strong lines.
Extreme levels: thin red lines from which the price has previously bounced. These are sources of trading signals.
Yellow lines: trend lines, trend channels, and any other technical patterns.
Indicator 1 on COT charts: the net position size of each trader category.
You have already liked this post today
*A análise de mercado aqui postada destina-se a aumentar o seu conhecimento, mas não dar instruções para fazer uma negociação.


