یہ بھی دیکھیں

Yesterday, oil prices demonstrated significant volatility, with a sharp decline from the resistance level of 68.69, dropping below the support level of 66.77. This trend suggests further price declines, targeting the next level at 65.27.
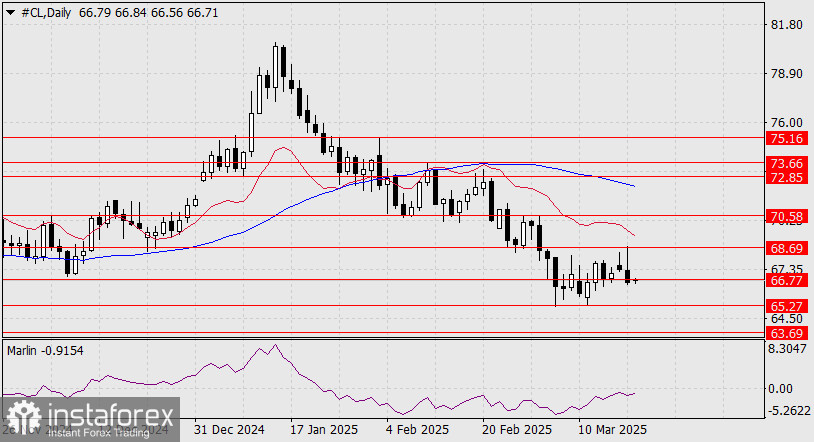
If prices break below this support, it could lead to further declines toward 63.69, which was the low in April 2023. The Marlin oscillator is already showing early signs of a downward reversal without having tested the zero line.
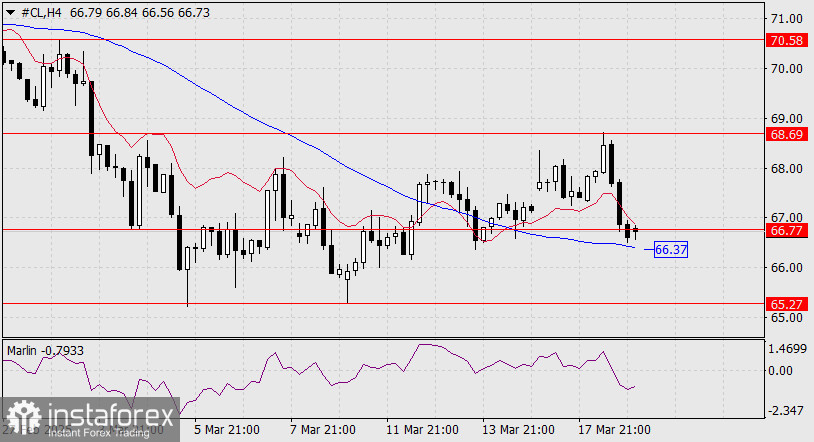
On the H4 chart, the MACD line at 66.37 serves as a support level and acts as an obstacle to further price declines. This level corresponds with the low recorded on March 13. A breakout below this point would establish a first target at 65.27.
You have already liked this post today
*تعینات کیا مراد ہے مارکیٹ کے تجزیات یہاں ارسال کیے جاتے ہیں جس کا مقصد آپ کی بیداری بڑھانا ہے، لیکن تجارت کرنے کے لئے ہدایات دینا نہیں.


