Lihat juga


 03.04.2024 01:41 PM
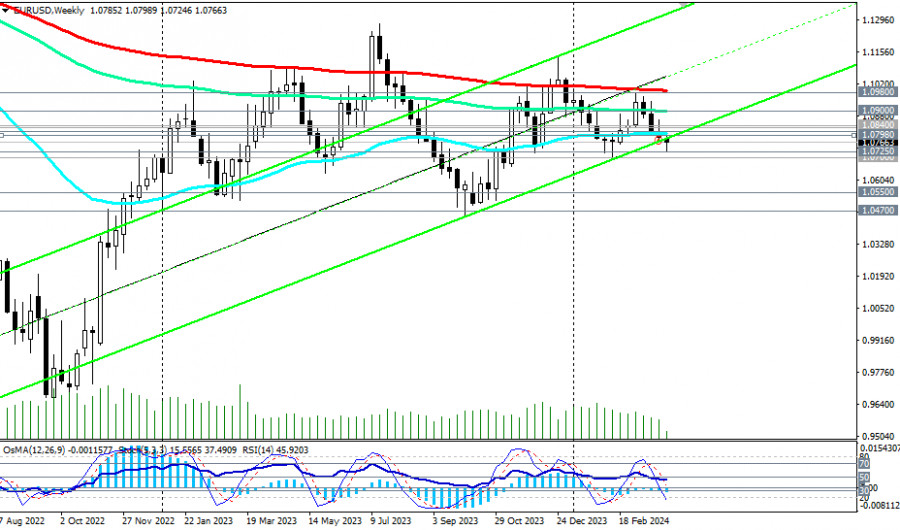
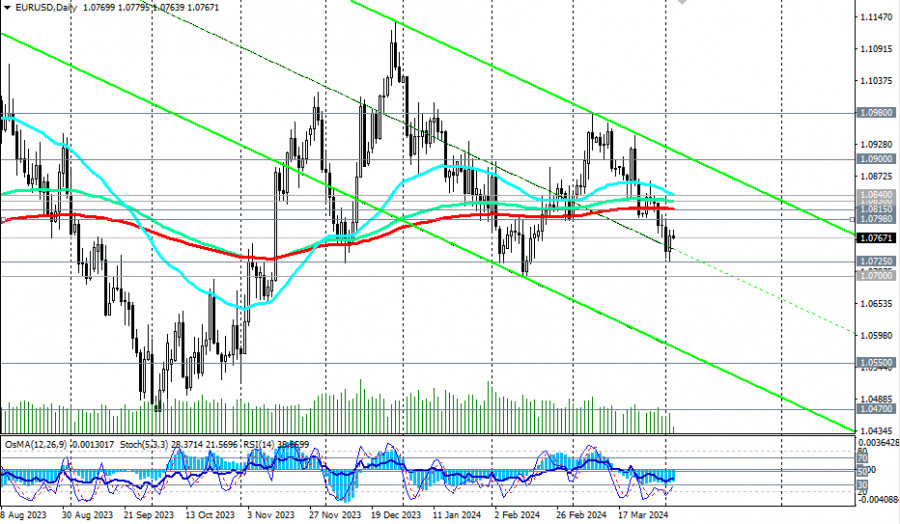
EUR/USD dropped into the zone of the medium-term bearish market after breaking through the zone of key support levels at 1.0840 (50 EMA on the daily chart), 1.0830 (144 EMA on the daily chart), and 1.0815 (200 EMA on the daily chart).
With the breakthrough of the important support levels at 1.0805 (50 EMA on the weekly chart) and 1.0775 (lower line of the upward channel on the weekly chart), the pair also "declared its intention" for further decline into the territory of the long-term bearish market, located below the key resistance levels at 1.0900 (144 EMA on the weekly chart), 1.0980 (200 EMA on the weekly chart).
At the same time, technical indicators RSI, OsMA, and Stochastic on the daily and weekly charts are on the sellers' side, also signaling the advantage of short positions.
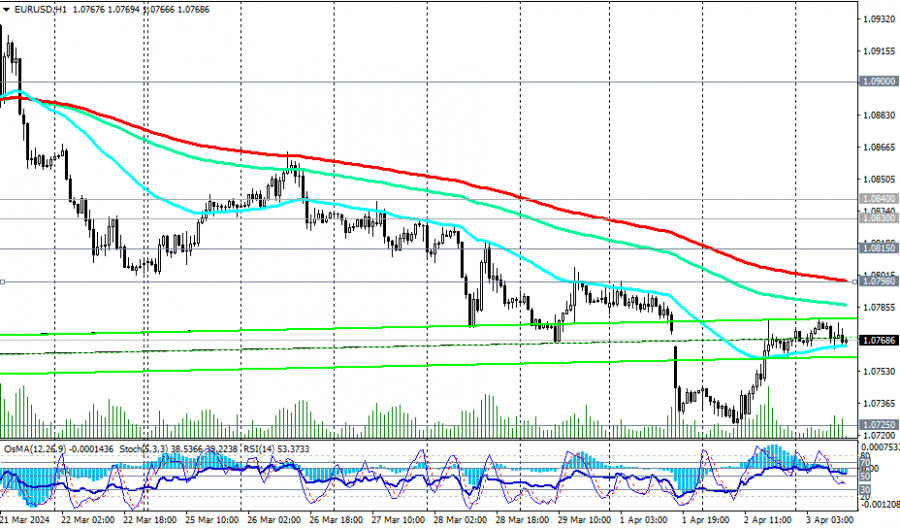
Therefore, in the current situation, preference should be given to short positions on EUR/USD. However, a breakthrough of today's low at 1.0764 may become the very first signal for new positions.
The nearest downward targets are located at local support levels 1.0725 and 1.0700. Their breakthrough will open the way for EUR/USD to decline towards the lower boundary of the downward channel on the daily chart and levels 1.0550, 1.0500, and 1.0470.
In an alternative scenario, the first signal for the resumption of long positions may be a breakthrough of the important short-term resistance level at 1.0798 (200 EMA on the 1-hour chart). Furthermore, a breakthrough of the zone of key resistance levels at 1.0815, 1.0830, and 1.0840 will bring EUR/USD into the territory of the medium-term bullish market, making long positions preferable again with targets near key resistance levels at 1.0900, 1.0980, 1.1000.
Trading Scenarios
Main Scenario: Sell Stop 1.0755. Stop-Loss 1.0805. Targets 1.0725, 1.0700, 1.0660, 1.0600, 1.0550, 1.0500, 1.0470, 1.0400, 1.0300
Alternative Scenario: Buy Stop 1.0845. Stop-Loss 1.0790. Targets 1.0900, 1.0920, 1.0980, 1.1000, 1.1040, 1.1090, 1.1100, 1.1140, 1.1200, 1.1275, 1.1300, 1.1400, 1.1500
"Targets" correspond to support/resistance levels. This also does not mean that they will necessarily be reached, but they can serve as a guideline for planning and placing trading positions.
You have already liked this post today
* Analisis pasaran yang disiarkan di sini adalah bertujuan untuk meningkatkan kesedaran anda, tetapi tidak untuk memberi arahan untuk membuat perdagangan.
Tidak ada peristiwa makroekonomi yang dijadualkan untuk hari Jumaat. Perkembangan fundamental juga akan terbatas, tetapi faktor-faktor yang mempengaruhi pembentukan harga sedikit tidak jelas. Pada hari Rabu dan Khamis, terdapat alasan
Analisis Dagangan Hari Khamis Carta 1 Jam pasangan GBP/USD Pada hari Khamis, pasangan GBP/USD meneruskan penurunan yang tidak menentu dalam saluran mendatar dan gagal membuat penembusan, tidak seperti pasangan EUR/USD
Pada hari Khamis, pasangan mata wang EUR/USD secara tidak dijangka keluar dari saluran mendatar di mana ia telah berdagang selama tiga minggu. Ini berlaku semasa sesi dagangan AS, walaupun tiada
Analisis GBP/USD carta 5-Minit Pada hari Khamis, pasangan mata wang GBP/USD terus didagangkan dalam saluran mendatar yang dapat dilihat pada carta masa satu jam. Dua mesyuarat bank pusat — yang
Pada hari Khamis, pasangan mata wang EUR/USD menunjukkan aliran yang amat menarik. Untuk diingatkan, keputusan mesyuarat FOMC telah diumumkan pada malam Rabu, dan sekali lagi kami menganggapnya sebagai agresif. Penting
Dalam ramalan pagi saya, saya menumpukan pada tahap 1.3286 dan merancang untuk membuat kemasukan pasaran dari situ. Mari kita lihat carta 5 minit dan analisa apa yang berlaku. Penembusan
Dalam ramalan pagi, saya memberi tumpuan pada paras 1.1269 dan merancang untuk membuat keputusan kemasukan pasaran dari situ. Mari kita lihat carta 5 minit dan menganalisis apakah yang berlaku. Penurunan
Pasangan GBP/USD tidak menunjukkan pergerakan ketara pada hari Rabu. Selepas Jerome Powell menyatakan keperluan untuk lebih banyak masa menilai kesan ekonomi penuh daripada tarif Trump, dolar A.S. mengukuh seperti yang
Analisis Dagangan Hari Rabu Carta 1 Jam pasangan EUR/USD Pasangan mata wang EUR/USD terus berdagang dalam saluran mendatar pada hari Rabu, seperti yang dapat dilihat pada rangka masa satu
Pada hari Rabu, pasangan mata wang GBP/USD meneruskan dagangan dalam saluran mendatar, yang jelas kelihatan pada carta masa setiap jam. Hampir tiada pergerakan sepanjang hari, dan tiada peristiwa fundamental atau
Carta Forex
Versi-Web

Your IP address shows that you are currently located in the USA. If you are a resident of the United States, you are prohibited from using the services of InstaFintech Group including online trading, online transfers, deposit/withdrawal of funds, etc.
If you think you are seeing this message by mistake and your location is not the US, kindly proceed to the website. Otherwise, you must leave the website in order to comply with government restrictions.
Why does your IP address show your location as the USA?
Please confirm whether you are a US resident or not by clicking the relevant button below. If you choose the wrong option, being a US resident, you will not be able to open an account with InstaTrade anyway.
We are sorry for any inconvenience caused by this message.


