Lihat juga


 28.11.2023 11:45 PM
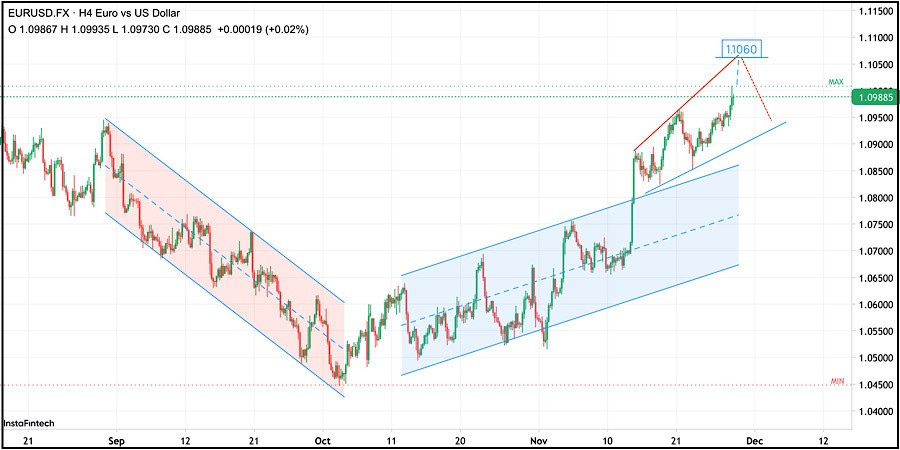
Since early September, the previous depicted downside movement was initiated with projected targets towards 1.0780 then 1.0500 where significant bullish recovery was originated.
Since then, the market has been demonstrating another ascending movement contained within the depicted Blue channel.
Around Mid-November, the EUR/USD pair has demonstrated a strong upside movement, bypassing the upper limit of the movement channel towards the level of 1.0980. The same price level is currently being challenged.
That's why, the market will probably tend to do some retracement towards 1.0900 for retesting.
However, the current ascending movement may pursue towards the price zone of 1.1050-1.1060 where a solid technical level is located.
This price zone around 1.1050 should be considered for a valid SELL Entry provided that no break above this upper limit can be achieved on the H4 chart.
You have already liked this post today
* Analisis pasaran yang disiarkan di sini adalah bertujuan untuk meningkatkan kesedaran anda, tetapi tidak untuk memberi arahan untuk membuat perdagangan.
Dengan kemunculan Perbezaan antara pergerakan harga pasangan mata wang silang EUR/JPY dengan penunjuk Pengayun Stochastic Oscillator yang turut diikuti dengan kehadiran corak Bullish 123 dan diikuti oleh Bullish Ross Hook
Pada carta 4 jam, pasangan silang mata wang GBP/AUD dilihat bergerak di bawah EMA (21), dan penunjuk Pengayun Stochastic berada dalam keadaan Persilangan JUAL (Crossing SELL). Maka, berdasarkan kedua-dua maklumat
Rancangan dagangan kami untuk beberapa jam akan datang ialah menjual emas di bawah 3,224, dengan sasaran di 3,203 dan 3,156. Kita perlu berwaspada terhadap sebarang kenaikan teknikal, kerana prospek masih
Pada hari Jumaat, pasangan EUR/USD terus meningkat tetapi berundur pada separuh kedua hari tersebut. Penurunan (iaitu pengukuhan dolar) adalah singkat, dan menjelang penghujung Jumaat, dolar AS sekali lagi mencatatkan kerugian
Pada carta 4 jam bagi instrumen komoditi Minyak Mentah, terdapat corak Inverted Head & Shoulders serta Corak 123 Menaik dan Perbezaan (Divergence) antara pergerakan harga #CL dengan penunjuk Pengayun Stochastic
Dengan kemunculan Divergence dari penunjuk Pengayun Stochastic dengan pergerakan harga XPD/USD pada carta 4-jamannya dan kemunculan corak Bullish 123 diikuti oleh pergerakan harganya yang bergerak di atas EMA (21) memberi
Minggu lalu, walaupun terdapat jurang menurun, pasaran kenaikan harga berjaya mendapatkan semula kedudukan mereka dengan berkesan. Pasaran kini semakin menghampiri titik di mana ia mungkin menghapuskan death cross Ichimoku harian
Video latihan

Your IP address shows that you are currently located in the USA. If you are a resident of the United States, you are prohibited from using the services of InstaFintech Group including online trading, online transfers, deposit/withdrawal of funds, etc.
If you think you are seeing this message by mistake and your location is not the US, kindly proceed to the website. Otherwise, you must leave the website in order to comply with government restrictions.
Why does your IP address show your location as the USA?
Please confirm whether you are a US resident or not by clicking the relevant button below. If you choose the wrong option, being a US resident, you will not be able to open an account with InstaTrade anyway.
We are sorry for any inconvenience caused by this message.

