यह भी देखें

 27.09.2024 01:47 PM
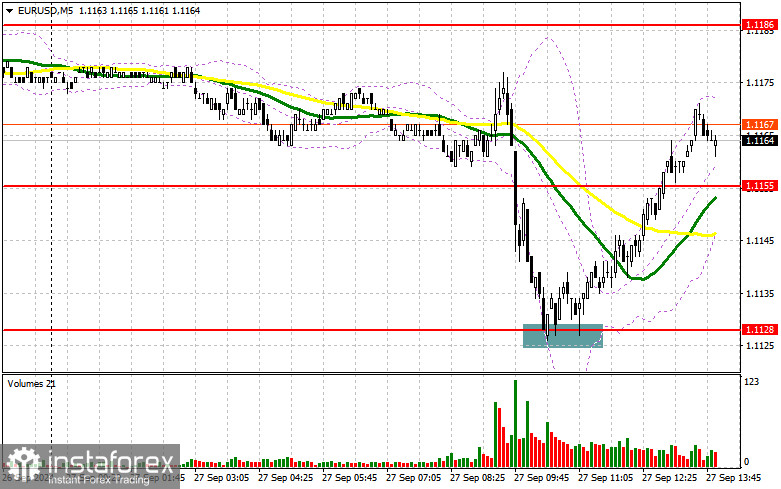
In my morning forecast, I highlighted the level of 1.1128 as a key decision point for trading. Let's review the 5-minute chart and analyze what transpired. The decline and the formation of a false breakout around 1.1128 provided an excellent entry point to buy the euro, leading to a rise of more than 40 points. The technical outlook for the second half of the day remains unchanged.
Requirements for Opening Long Positions on EUR/USD:
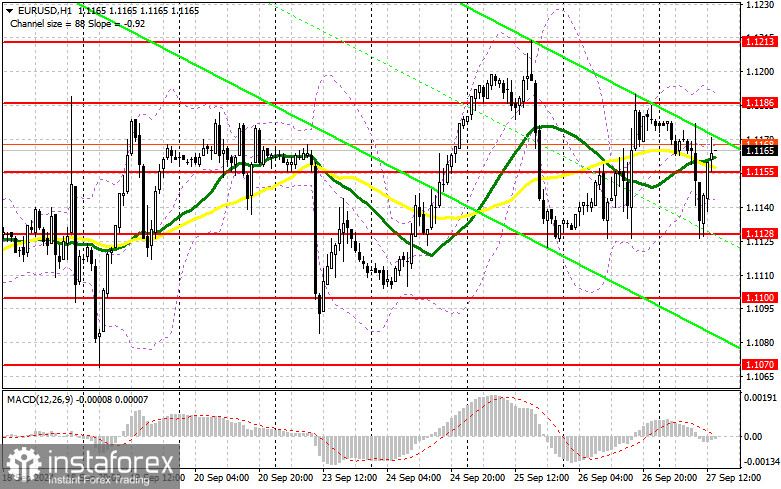
The euro is being bought on every decline and at every opportunity, reflecting strong bullish sentiment. The second half of the day might also favor the bulls, provided that U.S. data indicates a reduction in inflation. We expect figures for the core Personal Consumption Expenditures (PCE) index, as well as changes in U.S. household spending and income levels. A decline in these indices, coupled with a drop in income levels, would weaken the dollar's position and allow the euro to climb higher. In the event of a bearish reaction to the reports, only a confirmed false breakout around 1.1128 will be a suitable condition for opening new long positions, targeting a return to 1.1155. A breakout and retest from above this range could propel the pair higher, with a potential test of 1.1186. The final target will be the 1.1213 high, where I plan to take profits. Should the EUR/USD decline and there be no activity around 1.1128 in the second half of the day—since this level was already tested earlier—the pressure on the pair will return, leading to a larger sell-off. In such a case, I will enter long positions only after a false breakout around the next support at 1.1100. I will also consider opening long positions on a rebound from 1.1070, aiming for an intraday upward correction of 30-35 points.
Requirements for Opening Short Positions on EUR/USD:
Sellers have an opportunity to push the euro lower, but this requires strong U.S. statistics showing a sharp rise in American incomes and spending, as well as defending the 1.1186 level. A false breakout there will be the appropriate condition for short positions, targeting support at 1.1155 and 1.1130. Renewed buying interest is expected at these levels, especially if U.S. inflation data remains weak. A breakout and consolidation below 1.1130, followed by a retest from below, will offer another selling point, aiming for the 1.1100 level, where more significant euro buyers may emerge. The final target will be 1.1070, which would undermine any plans for further bullish growth. I will take profits there. If the EUR/USD moves up and bears are absent at 1.1186, bulls will gain control of the market. In this case, I will delay selling until reaching the next resistance at 1.1213, where I also plan to sell after a failed consolidation. I will open short positions immediately on a rebound from 1.1237, targeting a downward correction of 30-35 points.
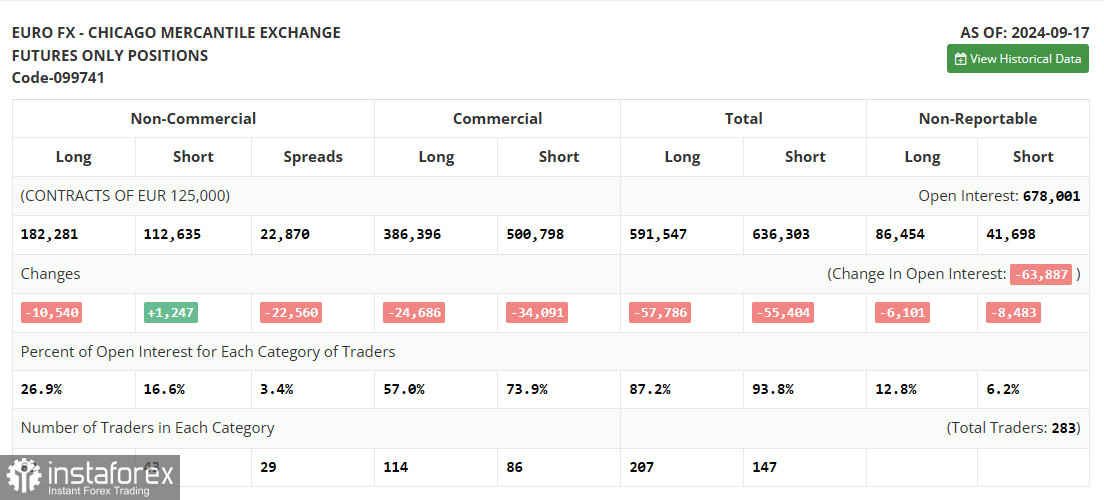
The COT (Commitment of Traders) report from September 17 showed a reduction in long positions and a slight increase in short ones. The Federal Reserve's decision to cut rates by 0.5% was quite unexpected, but traders didn't adjust their positions significantly, favoring the strengthening of the European currency over the U.S. dollar. In the near future, we expect speeches from several representatives of the Federal Reserve and the European Central Bank without any major fundamental statistics, so market volatility may decrease. However, this doesn't change the medium-term uptrend for the euro, and the lower the pair goes, the more attractive it becomes for buying. The COT report showed that long non-commercial positions declined by 10,540 to reach 182,281, while short non-commercial positions rose by 1,247 to 112,635. As a result, the gap between long and short positions narrowed by 20,560.
Indicator Signals:
Moving Averages:
The pair is trading around the 30- and 50-day moving averages, indicating market uncertainty.
Note: The period and prices of moving averages are considered by the author on the H1 hourly chart and differ from the general definition of classical daily moving averages on the D1 daily chart.
Bollinger Bands:
In case of a decline, the lower boundary of the indicator around 1.1128 will act as support.
Indicator Descriptions:
You have already liked this post today
*यहां पर लिखा गया बाजार विश्लेषण आपकी जागरूकता बढ़ाने के लिए किया है, लेकिन व्यापार करने के लिए निर्देश देने के लिए नहीं |


