यह भी देखें

 20.09.2024 10:49 AM
गुरुवार के ट्रेडों का विश्लेषण:
1H चार्ट पर EUR/USD
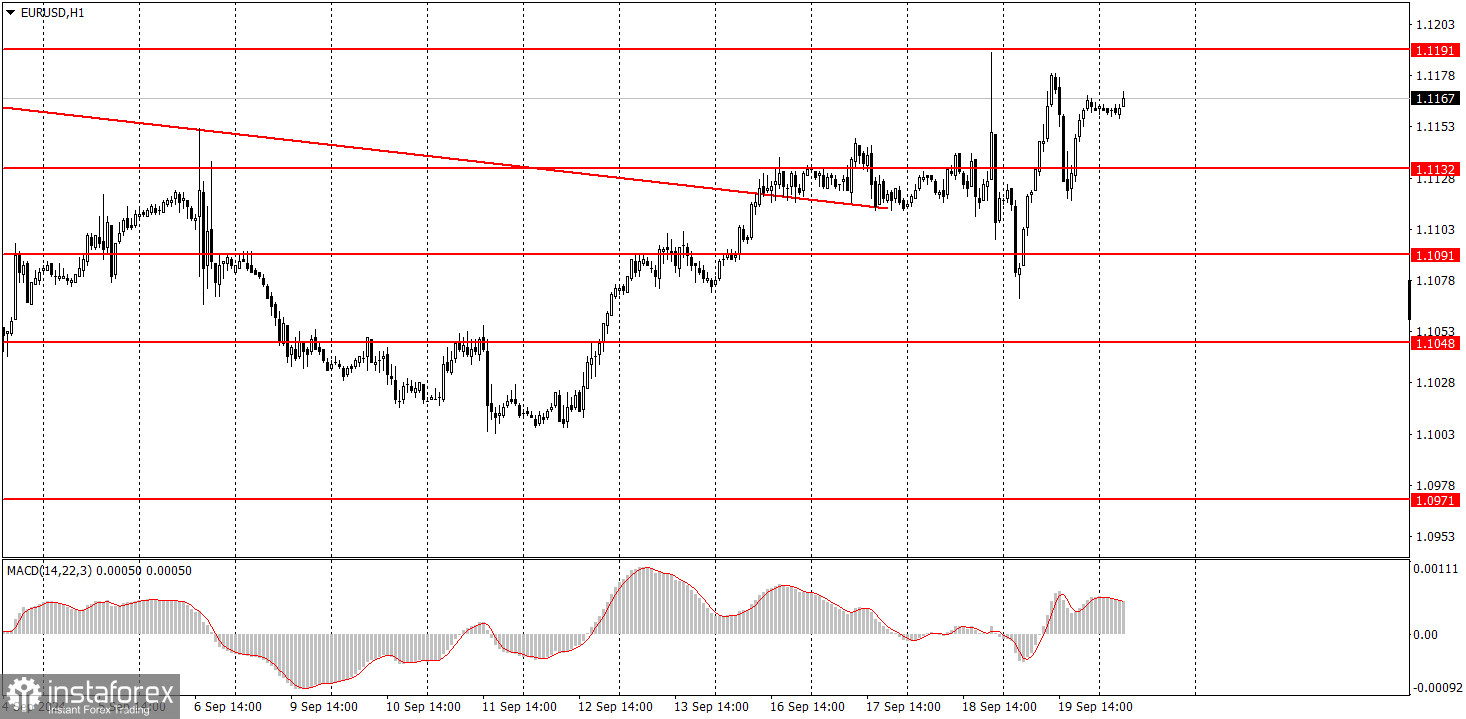
गुरुवार को EUR/USD पेअर ने अशांत स्थितियों में व्यापार करना जारी रखा। रात के दौरान, कीमत में काफी गिरावट आई, दोगुनी वृद्धि हुई, फिर से गिर गई, और फिर से बढ़ गई। जैसा कि हमने चेतावनी दी थी, बाजार ने गुरुवार को फेडरल रिजर्व की बैठक के परिणामों पर प्रतिक्रिया व्यक्त की। इसके अलावा, दोपहर के आसपास, बैंक ऑफ इंग्लैंड ने भी अपनी बैठक के परिणामों की घोषणा की, जिसने यूरो और बाजार की अस्थिरता को प्रभावित किया। इसलिए, सबसे अच्छा कदम बाजार से बाहर रहना या केवल बहुत मजबूत और सटीक संकेतों पर प्रवेश करना होता।
आम तौर पर, यूरो फिर से बढ़ गया, और डॉलर फिर से गिर गया, जो अब किसी को भी आश्चर्यचकित नहीं करता है। फेड मीटिंग से पहले कई दिनों तक डॉलर में गिरावट के बावजूद, जिसे डोविश परिदृश्य के लिए "अग्रिम मूल्य निर्धारण" के रूप में वर्णित किया जा सकता है, यह मीटिंग के बाद भी गिर गया। जैसा कि हम देख सकते हैं, डॉलर किसी भी परिस्थिति में गिर रहा है, चाहे कारक कुछ भी हों। यह ध्यान देने योग्य है कि यूरोपीय सेंट्रल बैंक ने पिछले सप्ताह दरों को कम करने का फैसला किया, जिसने जोड़े के मूल्य में वृद्धि को भी ट्रिगर किया।
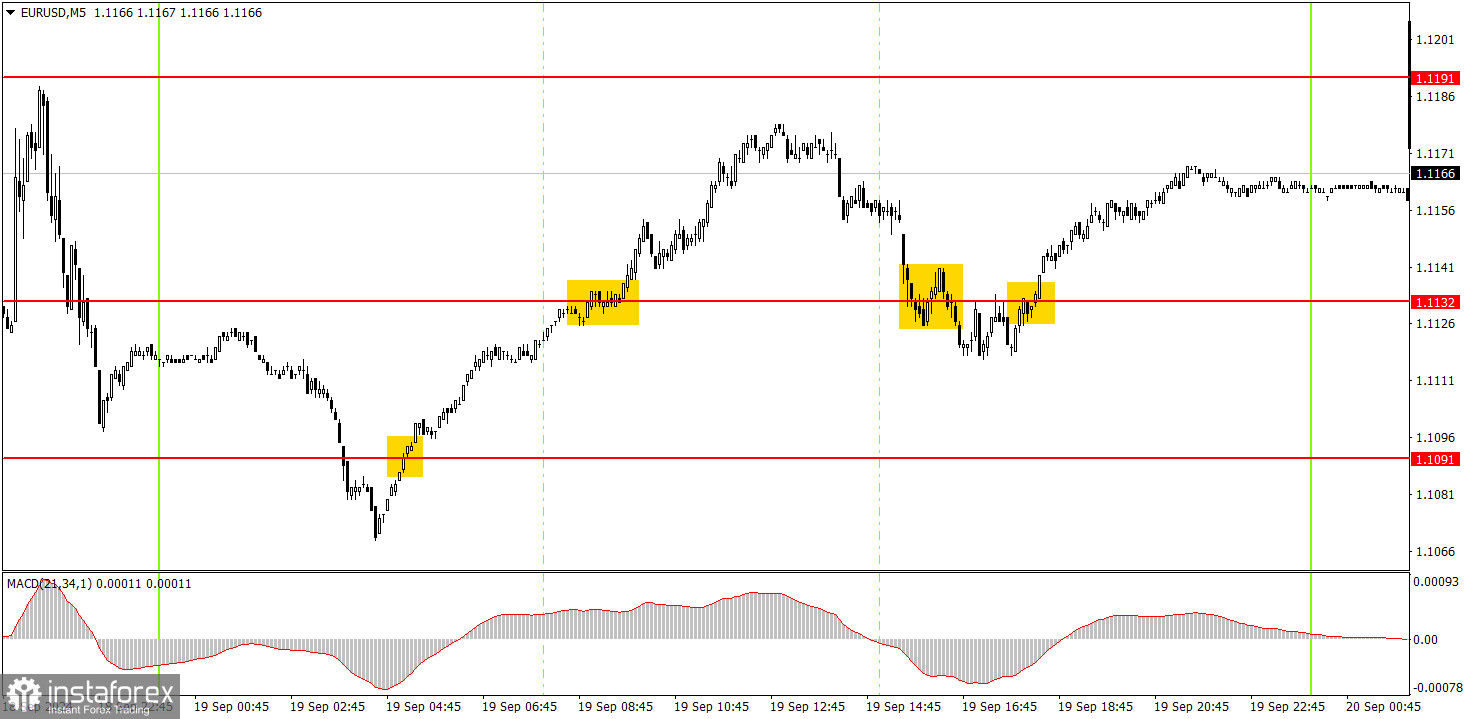
गुरुवार को 5 मिनट की समय सीमा में कई ट्रेडिंग सिग्नल बनाए गए। पहला रात के दौरान बनाया गया था, लेकिन यह कार्रवाई योग्य नहीं था। दूसरा, 1.1132 के स्तर के आसपास, एक लंबी स्थिति के साथ निष्पादित किया जा सकता था, लेकिन कीमत लक्ष्य स्तर तक नहीं पहुंची। अमेरिकी ट्रेडिंग सत्र के दौरान, 1.1132 के स्तर के आसपास दो और सिग्नल बनाए गए, लेकिन वे सटीक नहीं थे। बाजार अभी भी फेड मीटिंग के प्रभाव में था, जो सभी दिशाओं में अनियमित "स्विंग्स" की व्याख्या करता है। शुक्रवार को कैसे ट्रेड करें:
प्रति घंटे की समय सीमा में, पेअर के पास अभी भी नीचे की ओर रुझान बनाने का मौका है, लेकिन वे संभावनाएँ फीकी पड़ रही हैं। दुर्भाग्य से, डॉलर की तर्कहीन बिक्री मध्यम अवधि में आसानी से जारी रह सकती है, क्योंकि कोई नहीं जानता कि ईसीबी की ढील को अनदेखा करते हुए फेड की मौद्रिक ढील में बाजार कितने समय तक मूल्य निर्धारण करेगा। बाजार फेड द्वारा भविष्य में संभावित सभी दरों में कटौती को ध्यान में रखता है, उन कारकों पर कोई ध्यान नहीं देता जो डॉलर का समर्थन कर सकते हैं।
शुक्रवार तक, हम अंततः कह सकते हैं कि बाजार शांत हो गया है, जिसका अर्थ है कि आंदोलन कम अस्थिर होंगे। हम देख पाएंगे कि बाजार अब कैसा व्यवहार कर रहा है। यदि जोड़ी की वृद्धि जारी रहती है, तो यह संकेत देगा कि बाजार केवल डॉलर बेचने पर ध्यान केंद्रित करता है।
5M समय सीमा पर विचार करने के लिए मुख्य स्तर 1.0726-1.0733, 1.0797-1.0804, 1.0838-1.0856, 1.0888-1.0896, 1.0940, 1.0971, 1.1011, 1.1048, 1.1091, 1.1132, 1.1191 और 1.1275-1.1292 हैं। शुक्रवार को एकमात्र महत्वपूर्ण घटना ईसीबी अध्यक्ष क्रिस्टीन लेगार्ड का भाषण होगा। हालाँकि, चूंकि ईसीबी की बैठक पिछले सप्ताह हुई थी, इसलिए इस सप्ताह उनके कुछ नया कहने की संभावना नहीं है।
ट्रेडिंग सिस्टम के बुनियादी नियम:
1) सिग्नल की ताकत सिग्नल बनने में लगने वाले समय (बाउंस या लेवल ब्रेकथ्रू) से निर्धारित होती है। जितना कम समय लगेगा, सिग्नल उतना ही मजबूत होगा।
2) यदि झूठे संकेतों के कारण किसी भी स्तर के आसपास दो या अधिक ट्रेड खोले गए थे, तो उस स्तर से आने वाले बाद के संकेतों को अनदेखा किया जाना चाहिए।
3) एक सपाट बाजार में, कोई भी मुद्रा जोड़ी कई झूठे संकेत दे सकती है या बिल्कुल भी नहीं दे सकती है। किसी भी मामले में, एक सपाट बाजार के पहले संकेतों पर व्यापार बंद करना बेहतर है।
4) यूरोपीय सत्र की शुरुआत और अमेरिकी सत्र के बीच में ट्रेड खोले जाने चाहिए। इस अवधि के बाद, सभी ट्रेडों को मैन्युअल रूप से बंद किया जाना चाहिए।
5) प्रति घंटे की समय सीमा में, MACD संकेतों पर आधारित ट्रेड केवल अच्छी अस्थिरता और ट्रेंडलाइन या ट्रेंड चैनल द्वारा पुष्टि की गई प्रवृत्ति के बीच ही उचित हैं।
6) यदि दो स्तर एक दूसरे के बहुत करीब हैं (5 से 20 पिप्स), तो उन्हें समर्थन या प्रतिरोध क्षेत्र माना जाना चाहिए।
7) इच्छित दिशा में 15 पिप्स आगे बढ़ने के बाद, स्टॉप लॉस को ब्रेक ईवन पर सेट किया जाना चाहिए।
चार्ट पर क्या है:
समर्थन और प्रतिरोध मूल्य स्तर: लंबी या छोटी स्थिति खोलने के लिए लक्ष्य। आप उनके आस-पास लाभ लेने के स्तर रख सकते हैं।
लाल रेखाएँ: चैनल या ट्रेंड रेखाएँ जो वर्तमान प्रवृत्ति को दर्शाती हैं और पसंदीदा ट्रेडिंग दिशा को इंगित करती हैं।
MACD संकेतक (14,22,3): हिस्टोग्राम और सिग्नल लाइन दोनों को शामिल करते हुए, एक सहायक उपकरण के रूप में कार्य करता है और सिग्नल के स्रोत के रूप में भी इस्तेमाल किया जा सकता है।
महत्वपूर्ण भाषण और रिपोर्ट (हमेशा समाचार कैलेंडर में नोट किए गए) मुद्रा जोड़ी की चाल को गहराई से प्रभावित कर सकते हैं। इसलिए, उनके रिलीज़ के दौरान ट्रेडिंग करने के लिए अत्यधिक सावधानी बरतने की आवश्यकता होती है। मौजूदा चाल के विरुद्ध कीमतों में तेज उलटफेर से बचने के लिए बाजार से बाहर निकलना उचित हो सकता है।
शुरुआती लोगों के लिए, यह याद रखना महत्वपूर्ण है कि हर ट्रेड से लाभ नहीं मिलेगा। एक स्पष्ट रणनीति विकसित करना और प्रभावी धन प्रबंधन लंबी अवधि में ट्रेडिंग में सफलता की कुंजी है।
You have already liked this post today
*यहां पर लिखा गया बाजार विश्लेषण आपकी जागरूकता बढ़ाने के लिए किया है, लेकिन व्यापार करने के लिए निर्देश देने के लिए नहीं |


