Lihat juga


 02.04.2025 08:07 PM
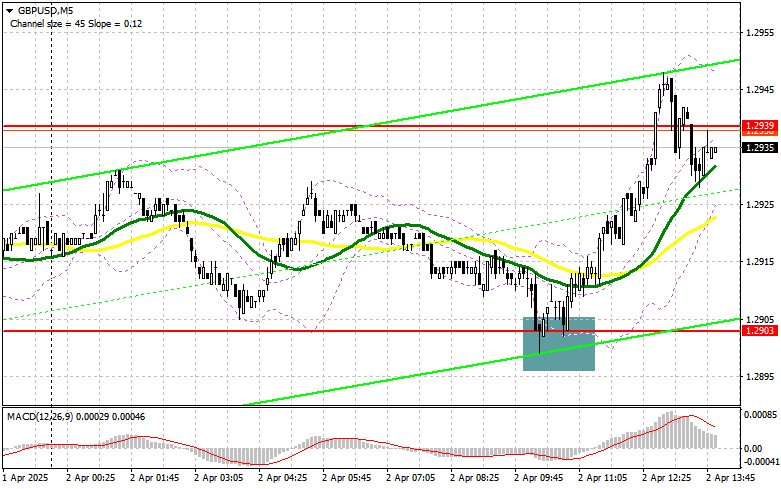
In my morning forecast, I highlighted the 1.2903 level and planned to make trading decisions based on it. Let's look at the 5-minute chart and analyze what happened. A decline followed by a false breakout at that level provided an entry point for buying the pound, which led to a rise in the pair of over 40 points. The technical outlook was revised for the second half of the day.
To open long positions on GBP/USD:
The lack of UK data allowed the pair to remain within the sideways channel. However, in the second half of the day, U.S. labor market data could significantly shift the market dynamic. Strong figures from the ADP employment report and U.S. factory orders, along with a cautious tone from FOMC member Adriana D. Kugler, could lead to dollar strength and pressure on the pound.
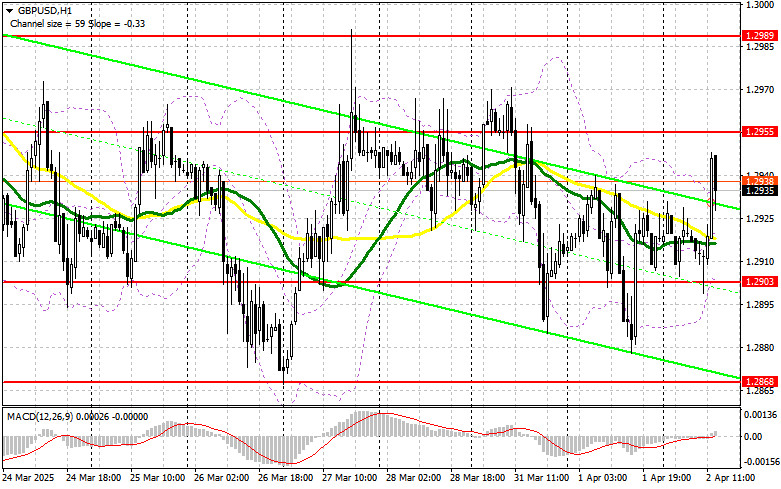
If the pair declines, I would prefer to act near the 1.2903 support area. A false breakout there, similar to the morning setup, would give a good entry point for long positions with a target of recovering to the 1.2955 resistance. A breakout and retest from top to bottom of that level will confirm another entry into long positions with the goal of updating 1.2990. The final target will be the 1.3010 area, where I plan to take profit.
If GBP/USD drops and buyers are inactive at 1.2903 in the second half of the day, pressure on the pound will increase significantly, putting more downward pressure on the pair. In that case, only a false breakout near 1.2868 will serve as a valid buy signal. I plan to buy GBP/USD immediately on a rebound from 1.2837 with an intraday correction target of 30–35 points.
To open short positions on GBP/USD:
Pound sellers are counting on a strong Trump and aggressive tariffs. But if U.S. data disappoints even before the official address from the U.S. President, the pair may rise, and I plan to take advantage of that. Only a false breakout around 1.2955 will provide an entry point for short positions targeting new support at 1.2903, which was formed yesterday.
A breakout and retest of that range from the bottom up will trigger stop-losses and open the path to 1.2868, invalidating buyers' attempts to regain control. The final target will be the 1.2837 area, where I plan to take profit. A test of that level will confirm a return to a bearish market.
If demand for the pound returns in the second half of the day and bears fail to act near 1.2955, short positions should be delayed until the next resistance at 1.2989 is tested. I will open shorts there only after a failed breakout. If there is no downward move from there either, I'll look for short entries on a rebound from 1.3010, targeting a 30–35 point correction.
Commitment of Traders (COT) Report:
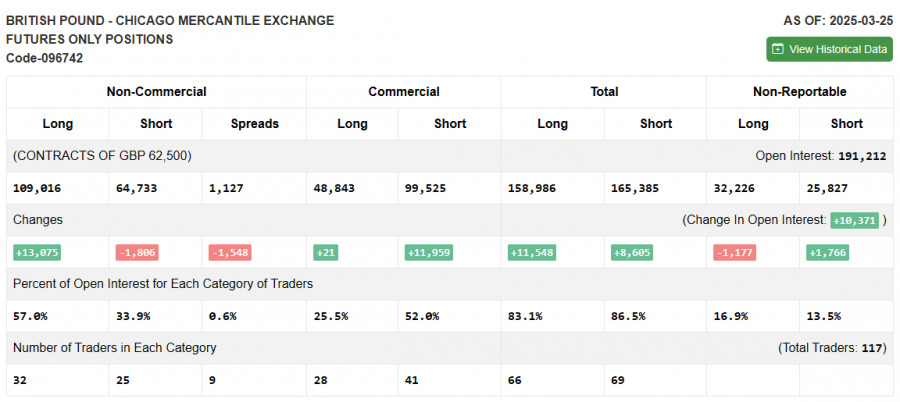
The March 25 COT report showed an increase in long positions and a reduction in shorts. Buying of the pound continues, and this is reflected on the chart. While many risk assets have declined, GBP/USD shows stability.
Given the latest inflation data from the UK and comments from Bank of England officials, the regulator is likely to keep its current policy unchanged at the upcoming April meeting, which could temporarily support the pound. However, the impact of U.S. tariffs remains significant. Rising concerns over a global economic slowdown will continue to pressure risk assets, including the pound.
The latest COT report showed that long non-commercial positions rose by 13,075 to 109,016, while short positions fell by 1,806 to 64,733. As a result, the gap between long and short positions narrowed by 1,548.
Indicator Signals:
Moving Averages: Trading is occurring near the 30- and 50-period moving averages, which indicates market uncertainty.
Note: The period and price of moving averages are considered by the author on the hourly (H1) chart and may differ from classical daily averages on the D1 chart.
Bollinger Bands: In case of a decline, the lower boundary of the indicator around 1.2905 will serve as support.
Indicator Descriptions:
You have already liked this post today
*Analisis pasar yang diposting disini dimaksudkan untuk meningkatkan pengetahuan Anda namun tidak untuk memberi instruksi trading.
Pada hari Selasa, pasangan GBP/USD terkoreksi turun setelah lonjakan lainnya pada hari Senin. Tidak ada alasan fundamental atau makroekonomi yang mendukung pergerakan tersebut baik pada hari Senin maupun Selasa. Bahkan
Pada hari Selasa, pasangan mata uang EUR/USD terus diperdagangkan dalam saluran menyamping, yang sekarang terlihat pada hampir semua kerangka waktu dan mudah dikenali bahkan sekilas. Sebagai pengingat, pada awal minggu
Pada hari Selasa, pasangan mata uang GBP/USD gagal melanjutkan pergerakan naik yang dimulai dengan sangat kuat pada hari Senin. Perlu diingat bahwa tidak ada alasan kuat bagi pound untuk naik
Pada hari Selasa, pasangan mata uang EUR/USD terus diperdagangkan dalam channel mendatar. Pergerakan datar terlihat pada grafik di atas. Minggu lalu, pasangan ini sempat keluar dari rentang, tetapi dengan cepat
Dalam prediksi pagi, saya menyoroti level 1,3421 dan merencanakan untuk membuat keputusan trading berdasarkan level tersebut. Mari simak grafik 5 menit dan perhatikan apa yang terjadi. Pound naik dan membentuk
Dalam ramalan pagi saya, saya menyoroti level 1.1378 dan merencanakan untuk membuat keputusan trading berdasarkan level tersebut. Mari kita lihat grafik 5 menit dan analisis apa yang terjadi. Penurunan memang
Pada hari Senin, pasangan GBP/USD naik sebanyak 130 pips. Begitulah "Senin yang membosankan" tanpa laporan makroekonomi atau pidato penting. Pound sterling naik lebih dari satu sen tanpa alasan yang jelas
Pada hari Senin, pasangan mata uang EUR/USD menunjukkan pergerakan yang agak bervariasi, tidak peduli bagaimana Anda melihatnya. Di satu sisi, pasangan ini menunjukkan pergerakan naik yang kuat meskipun tidak
Pada hari Senin, pasangan mata uang GBP/USD kembali trading lebih tinggi meskipun tidak ada alasan fundamental. Namun, saat ini, semua trader seharusnya sudah terbiasa dengan perkembangan semacam ini. Sementara euro
Pada hari Senin, pasangan mata uang EUR/USD menunjukkan pergerakan naik yang cukup baik sepanjang hari, tetapi tetap berada dalam channel mendatar sempit di 1,1312–1,1414 (garis Kijun-sen). Ingat bahwa kini euro
Chart Forex
versi web

Your IP address shows that you are currently located in the USA. If you are a resident of the United States, you are prohibited from using the services of InstaFintech Group including online trading, online transfers, deposit/withdrawal of funds, etc.
If you think you are seeing this message by mistake and your location is not the US, kindly proceed to the website. Otherwise, you must leave the website in order to comply with government restrictions.
Why does your IP address show your location as the USA?
Please confirm whether you are a US resident or not by clicking the relevant button below. If you choose the wrong option, being a US resident, you will not be able to open an account with InstaTrade anyway.
We are sorry for any inconvenience caused by this message.


