Lihat juga


 02.04.2025 11:23 AM
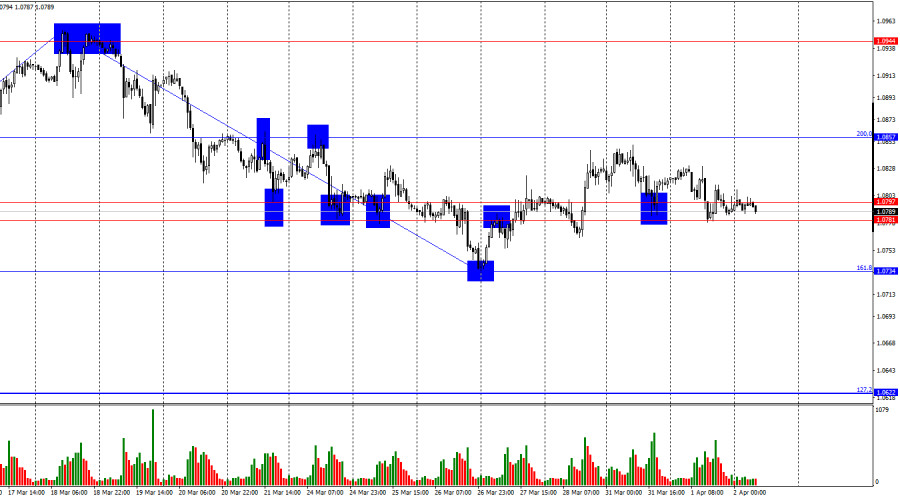
On Tuesday, the EUR/USD pair rebounded from the support zone at 1.0781–1.0797 but failed to rise to the 200.0% Fibonacci level at 1.0857. On Wednesday morning, the pair returned to the 1.0781–1.0797 zone. A rebound from this zone could lead to a modest upward move, but trader activity has been low lately. A break and consolidation below this zone will increase the likelihood of a continued decline toward the 161.8% retracement level at 1.0734.
The wave pattern on the hourly chart has shifted. The last completed upward wave only barely surpassed the previous high, while the most recent downward wave broke the previous low. This indicates a trend reversal to the bearish side. Although Donald Trump introduced new tariffs last week, causing bears to step back temporarily, it's likely that more tariffs will follow this week, potentially allowing bulls to mount a counterattack. However, the bulls are losing momentum day by day.
Tuesday's news failed to support either bulls or bears. The most important report in my view—inflation in the Eurozone—slowed to 2.2% y/y, while core inflation dropped to 2.4%. This gave bears a reason to continue pressing the euro, but the Eurozone unemployment rate fell to 6.1%, which is a positive sign for the euro. As a result, the euro avoided a sharp drop in the first half of the day.
In the U.S., the ISM Manufacturing PMI disappointed, and the JOLTS job openings report was also worse than expected. Despite all of this, neither side was able to create meaningful momentum—yesterday was simply a day of disappointments.
Donald Trump has yet to make any announcements regarding new tariffs, leaving traders on edge. The 1.0781–1.0797 zone remains a key decision point for trading strategy.
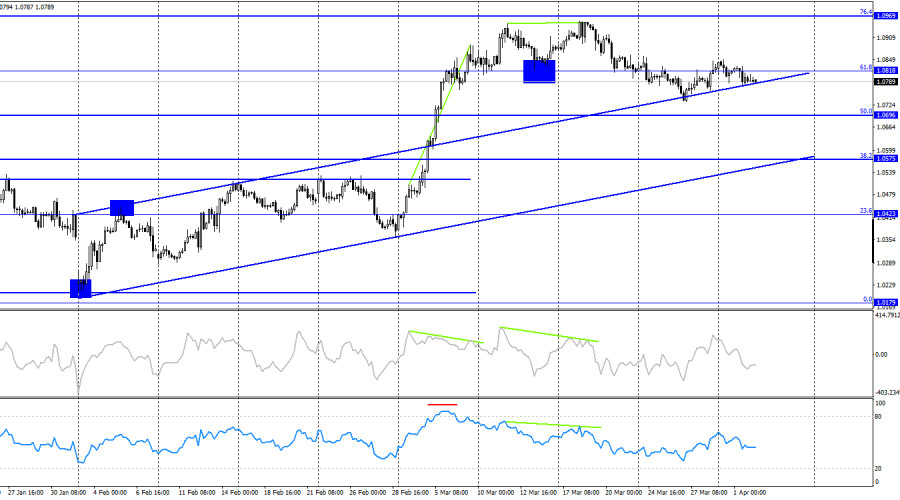
The pair showed a slight rebound on the 4-hour chart, but I still expect a reversal in favor of the U.S. dollar and further decline toward the 50.0% retracement level at 1.0696 and the 38.2% level at 1.0575. A more aggressive drop in the euro is unlikely for now, but a 200-point decline would be well within reason. No divergence signals are currently forming on any indicator.
Commitments of Traders (COT) Report
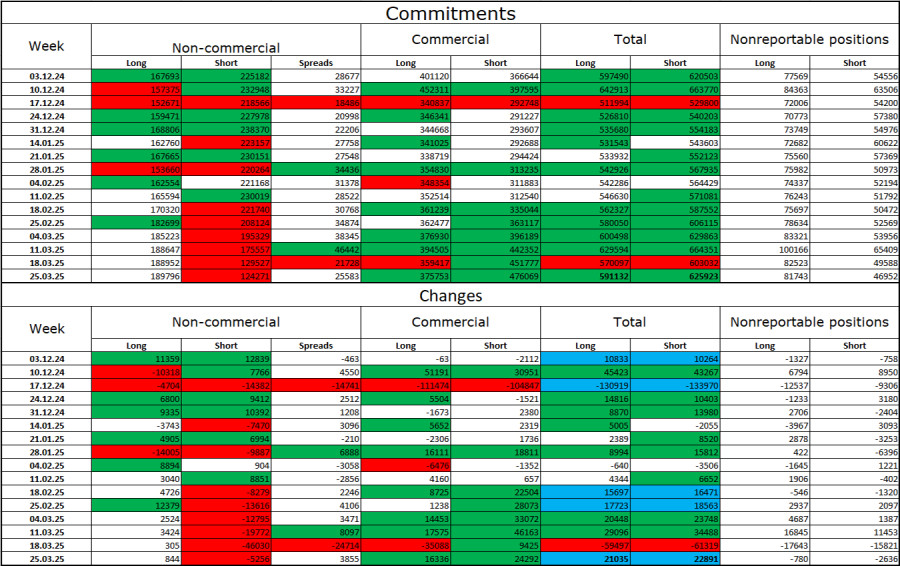
During the latest reporting week, professional traders opened 844 long positions and closed 5,256 short positions. Sentiment among the "Non-commercial" group has returned to bullish—thanks to Donald Trump. Total long positions now stand at 190,000, while shorts are at 124,000.
For 20 consecutive weeks, large players had been reducing exposure to the euro, but for the past 7 weeks they've been cutting short positions and increasing longs. The divergence in monetary policy between the ECB and the Fed still favors the U.S. dollar due to a widening interest rate spread. However, Trump's trade policies are becoming a more significant market-moving factor, as they could have a dovish impact on the Fed's approach and even trigger a recession in the U.S. economy.
News Calendar for the U.S. and Eurozone
The April 2 calendar includes only one notable event, and its impact may be limited to the second half of the day. However, I'll reiterate: Trump can announce new tariffs at any moment.
EUR/USD Forecast and Trading Recommendations
Fibonacci levels are drawn from 1.0529 to 1.0213 on the hourly chart, and from 1.1214 to 1.0179 on the 4-hour chart.
You have already liked this post today
*Analisis pasar yang diposting disini dimaksudkan untuk meningkatkan pengetahuan Anda namun tidak untuk memberi instruksi trading.
Dengan munculnya Divergence antara pergerakan harga pasangan mata uang silang AUD/JPY dengan indikator Stochastic Oscillator serta pergerakan harga AUD/JPY yang berada diatas WMA (30 Shift 2) yang juga memiliki kemiringan
Bila Kita perhatikan pada chart 4 jamnya, instrumen komoditi Emas nampak terlihat masih bergerak dalam bias yang Bullish, namun dengan kemunculan Divergence antara pergerakan harga Emas dengan indikator Stochastic Oscillator
Dengan pergerakan harga pasangan mata uang silang AUD/CAD yang bergerak diatas WMA (21) yang memiliki kemiringan yang menukik keatas serta munculnya Convergence antara pergerakan harga AUD/CAD dengan indikator Stochastic Oscillator
Bila Kita perhatikan chart 4 jam dari pasangan mata uang silang GBP/CHF, maka nampak ada beberapa fakta-fakta yang menari. Pertama, munculnya pola Triangle yang diikuti oleh pergerakan EMA (21)-nya yang
Indikator eagle telah mencapai level overbought. Namun, logam ini masih bisa mencapai level tinggi di sekitar 8/8 Murray, yang merupakan penghalang kuat bagi emas. Di bawah area ini, kita bisa
Dengan munculnya Konvergensi antara pergerakan harga pasangan mata uang utama USD/JPY dengan indikator Stochastic Oscillator serta posisi EMA (100) yang berada diatas harga, maka dalam waktu dekat ini USD/JPY berpotensi
Dari apa yang terlihat di chart 4 jamnya pasangan mata uang silang EUR/GBP, nampak terlihat pergerakan harganya bergerak diatas EMA (100) dimana ini menandakan Buyers yang mendominasi pasangan mata uang
Harga emas terus mendapatkan dukungan di tengah ketidakpastian yang menyelimuti masa depan perang tarif yang diprakarsai oleh Donald Trump. Harga emas telah naik hampir secara vertikal selama empat bulan. Pendorong
Chart Forex
versi web

Your IP address shows that you are currently located in the USA. If you are a resident of the United States, you are prohibited from using the services of InstaFintech Group including online trading, online transfers, deposit/withdrawal of funds, etc.
If you think you are seeing this message by mistake and your location is not the US, kindly proceed to the website. Otherwise, you must leave the website in order to comply with government restrictions.
Why does your IP address show your location as the USA?
Please confirm whether you are a US resident or not by clicking the relevant button below. If you choose the wrong option, being a US resident, you will not be able to open an account with InstaTrade anyway.
We are sorry for any inconvenience caused by this message.


