Voir aussi


 09.01.2024 11:08 AM
Eurozone retail sales decreased by 0.3% in November compared to the previous month, matching analysts' forecasts.
In terms of the information flow, there were speeches by Federal Reserve representatives. One of them expressed the opinion about a possible increase in the refinancing rate in case of inflation growth in the USA, while another head of the Federal Reserve Bank, on the contrary, considers an early reduction of the key rate.
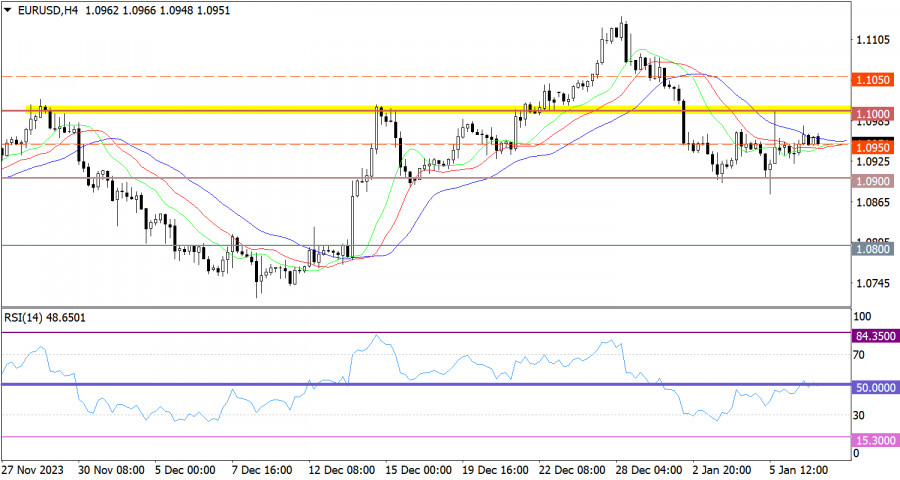
The EUR/USD currency pair has been relatively stable since last Friday, forming doji candles on the daily chart. This price action indicates a characteristic stagnation, which could lead to an accumulation of trading forces.
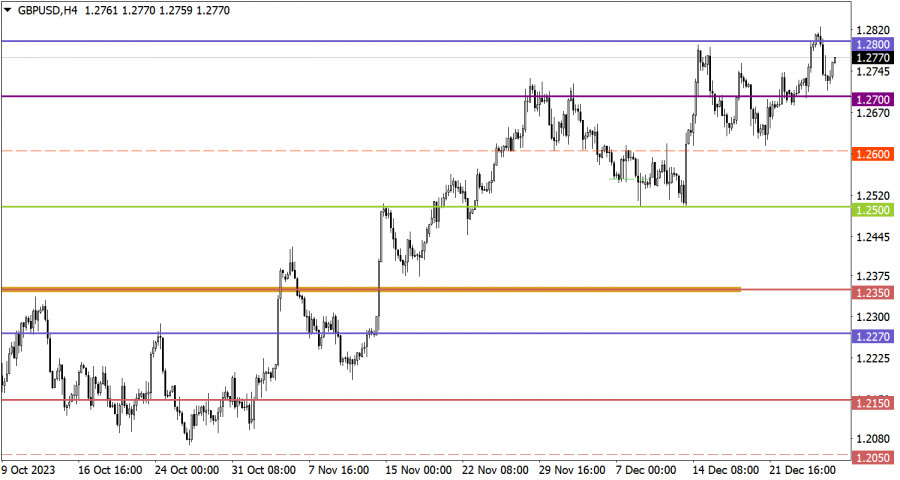
The GBP/USD currency pair shows an upward trend over several days. However, when examining the trading chart over several weeks, a characteristic flat is observed between the levels of 1.2600 and 1.2700.
Today, the main focus should be on the unemployment rate in the European Union, which is expected to rise from 6.5% to 6.6%. This could potentially lead to some weakening of the euro if the data matches the statistics.
Prolonged stagnation at one level can eventually lead to speculative price jumps. For this reason, the current stagnation should be considered as a lever for subsequent price movements. The optimal approach is the method of outgoing impulse, which takes into account a local spike in activity.
In this case, the upward cycle began from the lower boundary at 1.2600. It is possible that near the 1.2700 mark, there will be a reduction in the volume of long positions, which could lead to a slowdown in the upward cycle.
The candlestick chart type is white and black graphic rectangles with lines above and below. With a detailed analysis of each individual candle, you can see its characteristics relative to a particular time frame: opening price, closing price, intraday high and low.
Horizontal levels are price coordinates, relative to which a price may stop or reverse its trajectory. In the market, these levels are called support and resistance.
Circles and rectangles are highlighted examples where the price reversed in history. This color highlighting indicates horizontal lines that may put pressure on the asset's price in the future.
The up/down arrows are landmarks of the possible price direction in the future.
You have already liked this post today
*The market analysis posted here is meant to increase your awareness, but not to give instructions to make a trade.
Dans ma prévision du matin, j'ai attiré l'attention sur le niveau de 1,1257 et j'avais prévu de baser mes décisions d'entrée autour de ce niveau. Regardons le graphique
Il n'y a aucun événement macroéconomique prévu pour vendredi. Les développements fondamentaux seront également limités, mais il est entièrement incertain quels facteurs influencent la formation des prix. La livre sterling
Jeudi, la paire GBP/USD a continué sa baisse irrégulière à l'intérieur du canal latéral et n'a pas réussi à en sortir, contrairement à la paire EUR/USD. De notre point
Jeudi, la paire de devises EUR/USD est sortie de façon inattendue du canal latéral où elle se trouvait depuis trois semaines. Cela s'est produit lors de la séance de trading
Jeudi, la paire de devises GBP/USD a continué d'évoluer à l'intérieur d'un canal latéral visible sur l'échelle horaire. Deux réunions de banques centrales - chacune d'elles pouvant être considérée comme
La paire de devises EUR/USD a présenté une tendance particulièrement intéressante jeudi. Pour rappel, les résultats de la réunion du FOMC ont été annoncés mercredi soir et nous les avons
Dans ma prévision matinale, je me suis concentré sur le niveau de 1.3286 et j'avais prévu de baser les entrées de marché à partir de celui-ci. Examinons le graphique
Dans ma prévision matinale, je me suis concentré sur le niveau de 1.1269 et j'avais prévu de prendre des décisions d'entrée sur le marché à partir de celui-ci. Jetons
La paire GBP/USD n'a montré aucun mouvement notable mercredi. Après que Jerome Powell ait déclaré qu'il avait besoin de plus de temps pour évaluer pleinement l'impact économique des tarifs
Your IP address shows that you are currently located in the USA. If you are a resident of the United States, you are prohibited from using the services of InstaFintech Group including online trading, online transfers, deposit/withdrawal of funds, etc.
If you think you are seeing this message by mistake and your location is not the US, kindly proceed to the website. Otherwise, you must leave the website in order to comply with government restrictions.
Why does your IP address show your location as the USA?
Please confirm whether you are a US resident or not by clicking the relevant button below. If you choose the wrong option, being a US resident, you will not be able to open an account with InstaTrade anyway.
We are sorry for any inconvenience caused by this message.


