Voir aussi


 27.05.2022 10:49 AM
As predicted in my previous review on EUR/USD, the most popular currency pair on Forex developed an upward movement yesterday. This means that market participants have quickly digested the FOMC minutes and resumed the bullish scenario. The fundamental factors also supported the euro bulls. Yesterday, the revised data on US GDP for the first quarter turned out to be below the estimate of -1.3% and actually stood at -1.5%. Against this backdrop, many investors feared that the US Federal Reserve may revise its aggressive approach towards monetary policy and start to ease it.
It is well known that the best way to tackle high inflation is to raise interest rates. However, this method works only when the economy is strong and everything goes according to the Fed's plan. Yesterday's data on GDP in the US showed once again that the world's leading economy is not doing well. Besides, the next two rate hikes of 50 basis points have most likely been priced in by the USD market players. Before moving on to the technical review, let me remind you that today we expect a block of macroeconomic data from the US later in the afternoon. This will include the data on personal income and spending as well as the core personal consumption expenditures price index.
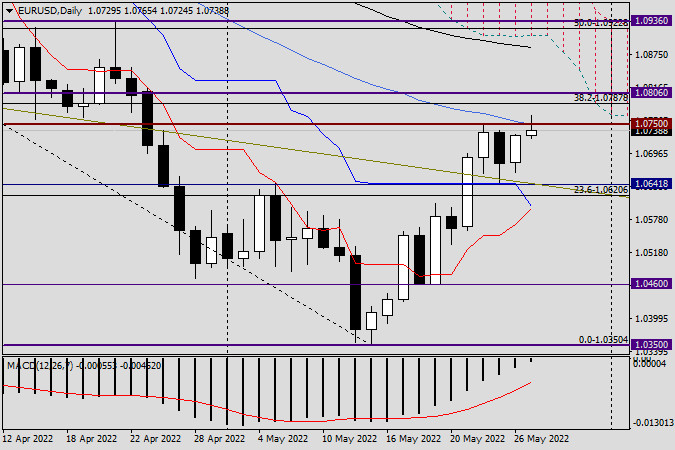
Daily chart
The bullish candlestick from yesterday with a closing price of 1.0729 was a natural transition from the previous black candlestick with a long lower shadow. On May 25, EUR/USD made an accurate pullback to the broken resistance of 1.0641 and then, following the rules of technical analysis, reversed to the upside. At the moment of writing, the euro bulls have already made an attempt to break above the 50-day simple moving average and the strong resistance level of 1.0750. These attempts have failed so far as the price made a downside pullback from this level and the 50-day MA, even though this movement was very weak. If the pair closes the day above 1.0750, this will certainly confirm the bullish scenario, and a close of the weekly session above 1.0767 will further strengthen it. I will talk about this in more detail on Monday. In case a bearish candlestick pattern appears on the daily chart by the end of the day, the quote may struggle to overcome the 50-day MA and the levels of 1 1.0750 and 1.0767 or may even stop doing this.
Trading recommendations. I usually do not recommend opening new positions on Friday so that they are rolled over to Monday. Despite the fact that the bullish scenario is very likely, it is not a good idea to open buy trades under strong resistance levels such as the 50-day MA and the levels of 1.0750 and1.0767. I advise you to stay out of the market today as this is also an option. We will provide a more detailed technical analysis of EUR/USD on Monday based on the result of the weekly session.
Have a good day!
You have already liked this post today
*The market analysis posted here is meant to increase your awareness, but not to give instructions to make a trade.
Liens utiles : Mes autres articles sont disponibles dans cette section Cours InstaForex pour débutants Analyses Populaires Ouvrir un compte de trading Important : Les débutants en trading forex doivent
Avec l'apparition des figures de "Divergent" et de "Descending Broadening Wedge" sur le graphique de 4 heures de la paire de devises croisées AUD/JPY, bien que le mouvement
Sur le graphique de 4 heures de la paire de devises principale USD/JPY, on peut observer que l'indicateur Stochastic Oscillator forme un modèle de Double Bottom tandis que le mouvement
Tôt dans la session américaine, l'or se négocie autour du niveau de 3 310, où il se situe à la 21SMA et à l'intérieur d'un motif en triangle symétrique formé
Notre plan de trading pour les prochaines heures est de vendre en dessous de 1.1410 avec des cibles à 1.1370 et 1.1230. L'indicateur eagle donne un signal négatif, nous pensons
Liens utiles : Mes autres articles sont disponibles dans cette section Cours InstaForex pour débutants Analyses Populaires Ouvrir un compte de trading Important : Les débutants en trading forex doivent
D'un autre côté, si la pression baissière prévaut et que l'euro se consolide en dessous de 1.1370, cela pourrait être interprété comme un signal de vente avec des objectifs
L'indicateur Eagle montre des signaux de survente, nous pensons donc que l'or pourrait reprendre son cycle haussier à court terme après une correction technique et atteindre le seuil psychologique
Club InstaForex

Your IP address shows that you are currently located in the USA. If you are a resident of the United States, you are prohibited from using the services of InstaFintech Group including online trading, online transfers, deposit/withdrawal of funds, etc.
If you think you are seeing this message by mistake and your location is not the US, kindly proceed to the website. Otherwise, you must leave the website in order to comply with government restrictions.
Why does your IP address show your location as the USA?
Please confirm whether you are a US resident or not by clicking the relevant button below. If you choose the wrong option, being a US resident, you will not be able to open an account with InstaTrade anyway.
We are sorry for any inconvenience caused by this message.

