Voir aussi


 18.10.2021 11:02 AM
Last week, the Japanese yen became one of the major currencies that showed a decline against the US dollar. At the same time, it should be noted that the dollar/yen currency pair showed rather impressive growth. Perhaps this is caused by the aggravated epidemiological situation in the world, where the fourth wave of COVID-19 is rampant. It is unknown how many more waves of this hated and annoying pandemic will be. However, during the exacerbation of COVID-19, it was the US dollar that investors preferred and still prefer as a protective asset. This factor likely caused the growth of the USD/JPY pair. However, since this review is devoted to the technical component, we proceed to analyze price charts, and let's start with a weekly scale.
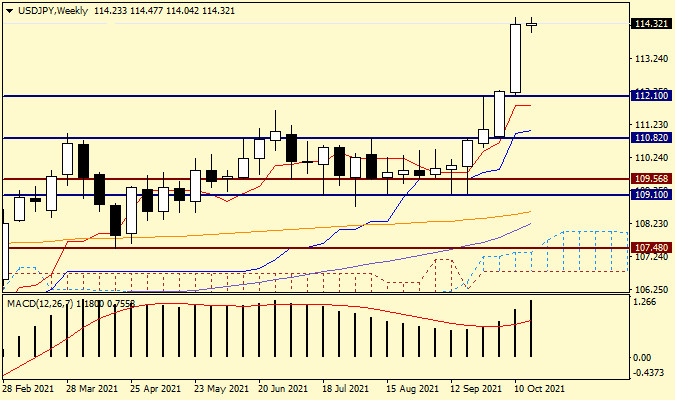
Weekly
As a result of the impressive growth shown at the auction on October 11-15, a large bullish candle appeared on the weekly chart with a closing price of 114.26. Thus, the hated resistance of sellers in the area of 112.00-112.25 was more than confidently broken through. However, one should not discount another interesting and quite strong mark of 113.00. We may see a pullback to this significant level during the trading of the current five-day period. If this happens, then there will be a good option for buying a pair. However, it is incorrect to determine the points for entering the market using a weekly timeframe. In the absence of the expected pullback and continuation of the rise from current prices, another landmark psychological level of 115.00 looms on the horizon of buyers. The task of bears in the current situation looks extremely difficult. To take control of the pair, they will need to absorb the hefty last white candle and close the weekly trading below the level of 112.00. In my opinion, such a task is almost impossible, although, as we know, everything happens on the market and nothing is particularly surprising.
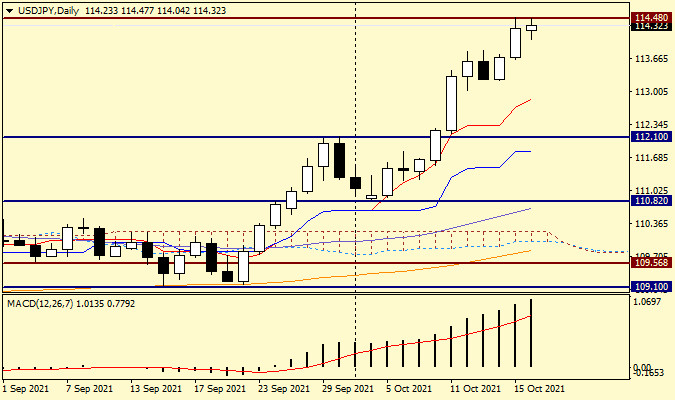
Daily
On this chart, all technical indicators turn up following the price, which can be characterized as support for growth and with a high probability of its continuation. The closest to the price (at 112.86) is the red Tenkan line of the Ichimoku indicator, so a pullback to Tenkan could be used to open long positions. However, given that the pair is currently trading near 114.28, such a deep pullback can be perceived as a change of course. As a more acceptable option for purchases, you can use a breakdown of the resistance of 114.48, fixing above this level and rolling back to it, after which you can try opening long positions. I am sure that this week we will return to the consideration of this currency pair. However, for now, I will outline the overall priority, which of course, comes down to purchases. Support levels: 114.00,113.40, and 113.00. Resistance passes at 114.60, 115.00, and 115.40. The general recommendation - we are looking for options to open purchases after corrective pullbacks, possibly to the designated support levels.
You have already liked this post today
*The market analysis posted here is meant to increase your awareness, but not to give instructions to make a trade.
Liens utiles : Mes autres articles sont disponibles dans cette section Cours InstaForex pour débutants Analyses Populaires Ouvrir un compte de trading Important : Les débutants en trading forex doivent
Si nous examinons le graphique de 4 heures de la paire de devises croisées GBP/CHF, plusieurs faits intéressants se dégagent. Tout d'abord, l'apparition d'un modèle de Triangle suivi du mouvement
Avec le mouvement des prix de la paire de devises croisée AUD/CAD passant au-dessus de la WMA (21), qui présente une inclinaison à la hausse, et l'apparition d'une convergence entre
L'indicateur eagle a atteint des niveaux de surachat. Cependant, le métal pourrait encore atteindre le sommet autour de 8/8 Murray, ce qui représente une barrière solide pour l'or. Sous cette
D'après ce qui est observé sur le graphique de 4 heures, la paire de devises croisée EUR/GBP semble se déplacer au-dessus de l'EMA (100), ce qui indique que les acheteurs
Avec l'apparition de la convergence entre le mouvement de prix du principal couple de devises USD/JPY avec l'indicateur Stochastic Oscillator et la position de l'EMA (100) qui est au-dessus
Liens utiles : Mes autres articles sont disponibles dans cette section Cours InstaForex pour débutants Analyses Populaires Ouvrir un compte de trading Important : Les débutants dans le trading forex
InstaForex en chiffres

Your IP address shows that you are currently located in the USA. If you are a resident of the United States, you are prohibited from using the services of InstaFintech Group including online trading, online transfers, deposit/withdrawal of funds, etc.
If you think you are seeing this message by mistake and your location is not the US, kindly proceed to the website. Otherwise, you must leave the website in order to comply with government restrictions.
Why does your IP address show your location as the USA?
Please confirm whether you are a US resident or not by clicking the relevant button below. If you choose the wrong option, being a US resident, you will not be able to open an account with InstaTrade anyway.
We are sorry for any inconvenience caused by this message.


