See also


 09.04.2025 06:47 AM
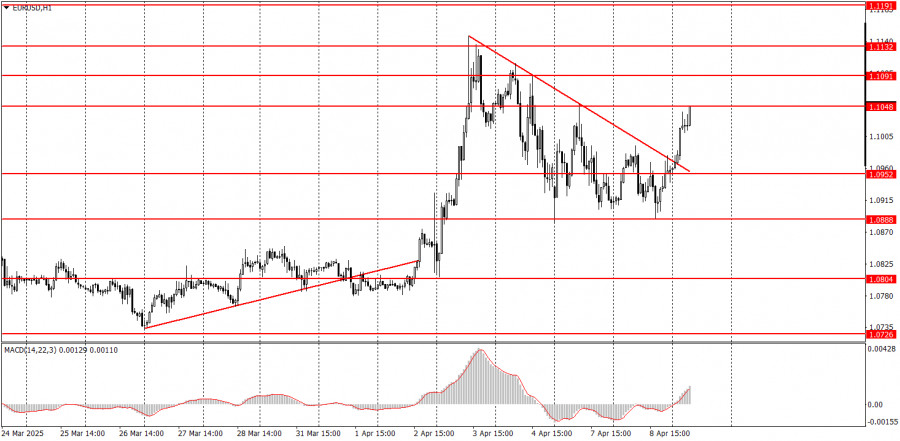
On Tuesday, the EUR/USD currency pair traded with low volatility throughout the day, mostly moving sideways. However, as we warned, this was merely the calm before the storm. There were no important macroeconomic events in the Eurozone or the U.S., but Donald Trump decided to raise trade tariffs on China by another 50%, as Beijing responded to the initial set of tariffs. All imports from China will be subject to the "Trump tax" of a modest 104%. The madness continued, and the dollar immediately resumed its decline. In the hourly timeframe, the descending trendline was broken, the pair corrected, and the upward movement may continue. As we had previously noted, any new tariffs from Trump are likely to trigger just one thing – further declines in the dollar and the U.S. stock market.
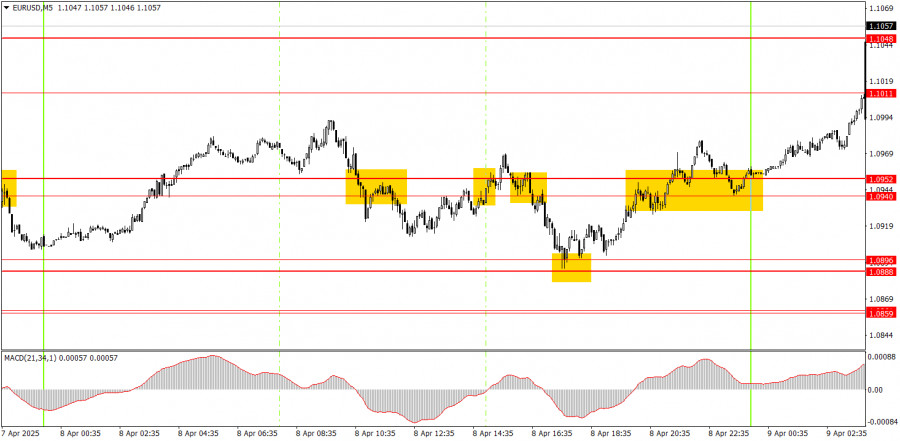
In the 5-minute chart, several trading signals were formed on Tuesday, but the market movements throughout the day were choppy and range-bound. Three signals appeared around the 1.0940–1.0952 area, two of which were false. However, the signal near the 1.0888–1.0896 area generated good profits and allowed for holding long positions longer than usual. The announcement about the new tariffs on China came in the evening, so expecting and preparing for another dollar sell-off was justified. As of now, this trade has yielded 155 pips in profit.
On the hourly timeframe, EUR/USD continues its upward trend. How long it will last is unknown, as no one knows how many more trade tariffs Trump will introduce. A further trade war escalation is highly possible, especially since many countries plan to respond to the U.S. with mirrored measures. Trump has already stated that any countermeasures will lead to new tariffs from the U.S.
On Wednesday, markets are likely to remain in a state of shock. We are not making any predictions about market movements. What's happening across global markets right now is difficult to describe in words.
On the 5-minute chart, consider the following levels for trading: 1.0596, 1.0678, 1.0726–1.0733, 1.0797–1.0804, 1.0859–1.0861, 1.0888–1.0896, 1.0940–1.0952, 1.1011, 1.1048, 1.1091, 1.1132–1.1140, 1.1189–1.1191, 1.1275–1.1292.
There will be no macroeconomic background in the U.S. or the Eurozone on Wednesday – not that it matters now. Not even the Fed Minutes due in the evening are relevant now. Everything still revolves around Trump and his trade policy.
Support and Resistance Levels: These are target levels for opening or closing positions and can also serve as points for placing Take Profit orders.
Red Lines: Channels or trendlines indicating the current trend and the preferred direction for trading.
MACD Indicator (14,22,3): A histogram and signal line used as a supplementary source of trading signals.
Important Events and Reports: Found in the economic calendar, these can heavily influence price movements. Exercise caution or exit the market during their release to avoid sharp reversals.
Forex trading beginners should remember that not every trade will be profitable. Developing a clear strategy and practicing proper money management are essential for long-term trading success.
You have already liked this post today
*The market analysis posted here is meant to increase your awareness, but not to give instructions to make a trade.
Analysis of Monday's Trades 1H Chart of GBP/USD On Monday, the GBP/USD pair rose by 130 pips. Such was the "boring Monday" without a macroeconomic report or important speech
Analysis of Monday's Trades 1H Chart of EUR/USD On Monday, the EUR/USD currency pair showed somewhat mixed movements, no matter how you look. On the one hand, the pair demonstrated
On Monday, the GBP/USD currency pair once again traded higher despite having no fundamental reasons. However, by now, all traders should be accustomed to such developments. While the euro tends
On Monday, the EUR/USD currency pair showed a decent upward movement during the day but remained within the narrow sideways channel of 1.1312–1.1414 (Kijun-sen line). Recall that the euro
In my morning forecast, I focused on the 1.1391 level and planned to make trading decisions from there. Let's look at the 5-minute chart and see what happened. Although there
Analysis of Friday's Trades 1H Chart of GBP/USD The GBP/USD pair also showed no interesting movements on Friday. Like the euro, the British pound remained very close to a flat
Analysis of Friday's Trades 1H Chart of EUR/USD The EUR/USD currency pair continued to trade sideways on Friday. The market continues to ignore all macroeconomic data, and last week once
The GBP/USD currency pair continued sideways trading on Friday, holding near three-year highs. The fact that the British pound refuses even a slight downward correction shows the market's disbelief
The EUR/USD currency pair continued trading sideways throughout Friday. In the second half of last week, the euro traded exclusively between the levels of 1.1321 and 1.1391, although the overall
InstaTrade
PAMM accounts

Your IP address shows that you are currently located in the USA. If you are a resident of the United States, you are prohibited from using the services of InstaFintech Group including online trading, online transfers, deposit/withdrawal of funds, etc.
If you think you are seeing this message by mistake and your location is not the US, kindly proceed to the website. Otherwise, you must leave the website in order to comply with government restrictions.
Why does your IP address show your location as the USA?
Please confirm whether you are a US resident or not by clicking the relevant button below. If you choose the wrong option, being a US resident, you will not be able to open an account with InstaTrade anyway.
We are sorry for any inconvenience caused by this message.


