See also


 26.03.2025 06:55 AM
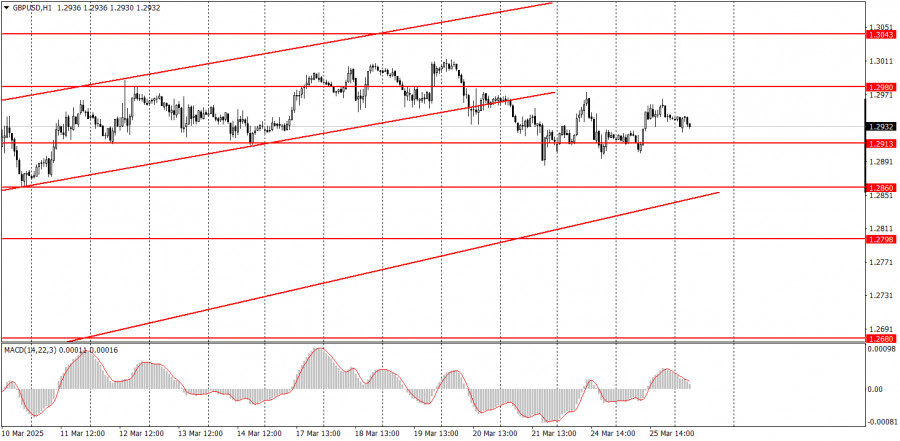
On Tuesday, the GBP/USD pair traded with a slight increase, but the overall movement of recent weeks increasingly resembles a flat market. The assumed sideways channel has no clearly defined boundaries, but the chart shows that the price moves sideways. As a result, the price rose yesterday without any particular reason, and today, it may just as easily fall. The uptrend is in place, as indicated by the ascending trendline. Therefore, a resumption of the British pound's growth is possible, even though there are no valid reasons for it apart from Donald Trump. However, if the market only considers that factor, what's the point of denying the move? No significant reports were released in the U.S. or the UK yesterday, so there is nothing to analyze fundamentally.
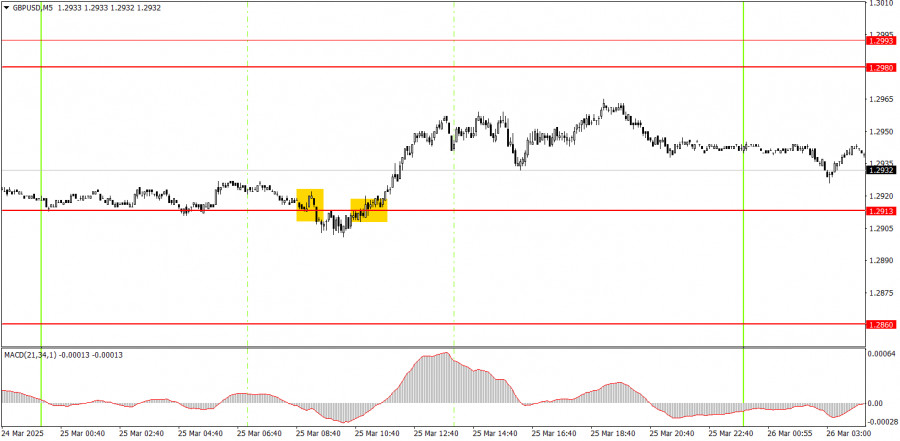
On the 5-minute timeframe, two trading signals were formed on Tuesday near the 1.2913 level. Let's recall that this is not the most important or strongest level, and the price has been moving sideways for several weeks. Any levels or lines can be easily ignored within such a sideways movement. Nevertheless, while the first sell signal was false, the second buy signal was successful. The first signal resulted in a small loss for novice traders, but the second brought a profit of about 25–30 pips.
On the hourly timeframe, the GBP/USD pair should have started a downtrend long ago, but Trump is doing everything to prevent that. In the medium term, we still expect the pound to fall with a target of 1.1800. However, it's unclear how long the dollar will continue to collapse "because of Trump." Once this movement ends, the technical picture on all timeframes could change dramatically, but long-term trends still point south. The British pound did not grow without cause, but the growth appeared excessive and irrational once again.
The GBP/USD pair may decline on Wednesday as the hourly chart's technical setup favors that direction. The pound is again overbought and unjustifiably expensive. At the same time, the movement may remain sideways in nature.
On the 5-minute timeframe, the following levels can be used for trading: 1.2301, 1.2372–1.2387, 1.2445, 1.2502–1.2508, 1.2547, 1.2613, 1.2680–1.2685, 1.2723, 1.2791–1.2798, 1.2848–1.2860, 1.2913, 1.2980–1.2993, 1.3043, 1.3102–1.3107. On Wednesday, the UK is scheduled to release the second estimate of February inflation, and in the U.S., a report on durable goods orders will be published. The UK inflation report may provoke a market reaction only if it differs from the first estimate.
Support and Resistance Levels: These are target levels for opening or closing positions and can also serve as points for placing Take Profit orders.
Red Lines: Channels or trendlines indicating the current trend and the preferred direction for trading.
MACD Indicator (14,22,3): A histogram and signal line used as a supplementary source of trading signals.
Important Events and Reports: Found in the economic calendar, these can heavily influence price movements. Exercise caution or exit the market during their release to avoid sharp reversals.
Forex trading beginners should remember that not every trade will be profitable. Developing a clear strategy and practicing proper money management are essential for long-term trading success.
You have already liked this post today
*The market analysis posted here is meant to increase your awareness, but not to give instructions to make a trade.
Analysis of Monday's Trades 1H Chart of GBP/USD On Monday, the GBP/USD pair rose by 130 pips. Such was the "boring Monday" without a macroeconomic report or important speech
Analysis of Monday's Trades 1H Chart of EUR/USD On Monday, the EUR/USD currency pair showed somewhat mixed movements, no matter how you look. On the one hand, the pair demonstrated
On Monday, the GBP/USD currency pair once again traded higher despite having no fundamental reasons. However, by now, all traders should be accustomed to such developments. While the euro tends
On Monday, the EUR/USD currency pair showed a decent upward movement during the day but remained within the narrow sideways channel of 1.1312–1.1414 (Kijun-sen line). Recall that the euro
In my morning forecast, I focused on the 1.1391 level and planned to make trading decisions from there. Let's look at the 5-minute chart and see what happened. Although there
Analysis of Friday's Trades 1H Chart of GBP/USD The GBP/USD pair also showed no interesting movements on Friday. Like the euro, the British pound remained very close to a flat
Analysis of Friday's Trades 1H Chart of EUR/USD The EUR/USD currency pair continued to trade sideways on Friday. The market continues to ignore all macroeconomic data, and last week once
The GBP/USD currency pair continued sideways trading on Friday, holding near three-year highs. The fact that the British pound refuses even a slight downward correction shows the market's disbelief
The EUR/USD currency pair continued trading sideways throughout Friday. In the second half of last week, the euro traded exclusively between the levels of 1.1321 and 1.1391, although the overall

Your IP address shows that you are currently located in the USA. If you are a resident of the United States, you are prohibited from using the services of InstaFintech Group including online trading, online transfers, deposit/withdrawal of funds, etc.
If you think you are seeing this message by mistake and your location is not the US, kindly proceed to the website. Otherwise, you must leave the website in order to comply with government restrictions.
Why does your IP address show your location as the USA?
Please confirm whether you are a US resident or not by clicking the relevant button below. If you choose the wrong option, being a US resident, you will not be able to open an account with InstaTrade anyway.
We are sorry for any inconvenience caused by this message.


