See also


 10.02.2025 07:40 AM
Crude Oil (CL)
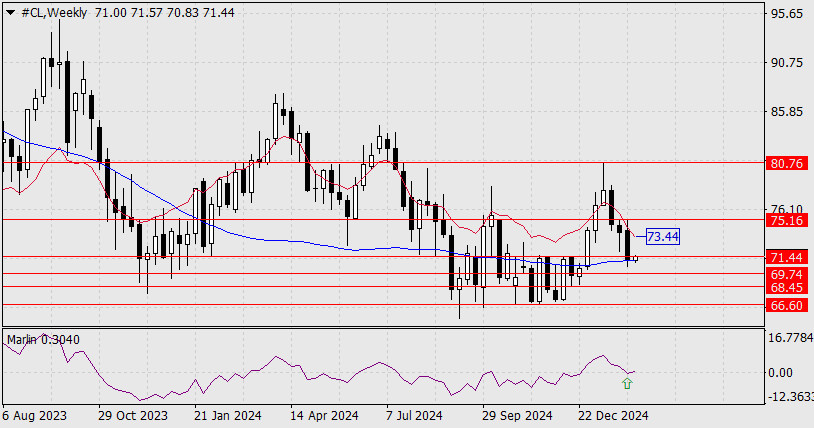
On the weekly chart, the price only briefly declined below the MACD indicator line before rebounding. The new trading week opened above this line, and the price is now testing resistance at 71.44. The Marlin oscillator's signal line is turning upward from the zero level, indicating potential upside momentum.
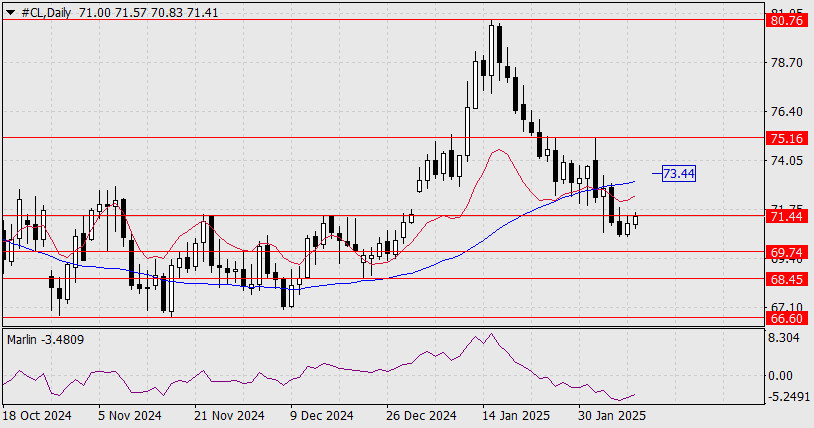
Given this technical setup, further declines toward 69.74 and 68.45 may not materialize. Instead, there is a higher probability of a rally toward 75.16.A break and consolidation above 71.44 will open the way toward the MACD line resistance at 73.44. If the price holds above 73.44, the next upward target will be 75.16.
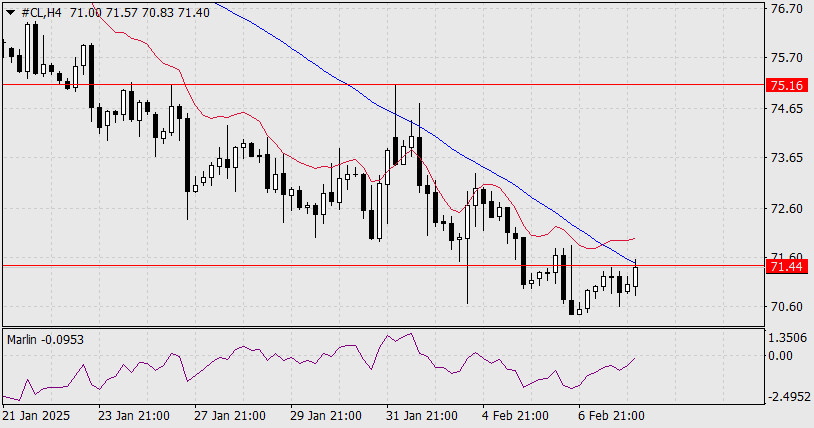
On the H4 timeframe, the MACD line is pressing against the 71.44 level from above, making it a key resistance zone. A confirmed breakout above this level would reinforce the bullish outlook, significantly strengthening buyers' positions. By the time this occurs, the Marlin oscillator is expected to enter positive territory, further supporting upward momentum.
Overall, the technical structure suggests a bullish shift, with key resistance levels 73.44 and 75.16 as potential targets.
You have already liked this post today
*The market analysis posted here is meant to increase your awareness, but not to give instructions to make a trade.
Our trading plan for the coming hours is to sell gold below 3,224, with targets at 3,203 and 3,156. We should be alert to any technical rebound, as the outlook
On the 4-hour chart of the Crude Oil commodity instrument, the Inverted Head & Shoulders pattern and Bullish Pattern 123 and Divergence between the #CL price movement and the Stochastic
With the appearance of Divergence from the Stochastic Oscillator indicator with the XPD/USD price movement on its 4-hour chart and the appearance of a Bullish 123 pattern followed
During the European session, the euro reached a new high around +2/8 Murray, located at 1.1473. This movement in EUR/USD occurred after the announcement by China's Ministry of Finance that
Early in the American session, gold is undergoing a strong technical correction after reaching a new high around 3,237.69 for now. Economic data from the United States will be released
Forex Chart
Web-version

Your IP address shows that you are currently located in the USA. If you are a resident of the United States, you are prohibited from using the services of InstaFintech Group including online trading, online transfers, deposit/withdrawal of funds, etc.
If you think you are seeing this message by mistake and your location is not the US, kindly proceed to the website. Otherwise, you must leave the website in order to comply with government restrictions.
Why does your IP address show your location as the USA?
Please confirm whether you are a US resident or not by clicking the relevant button below. If you choose the wrong option, being a US resident, you will not be able to open an account with InstaTrade anyway.
We are sorry for any inconvenience caused by this message.


