See also


 02.01.2025 01:21 PM
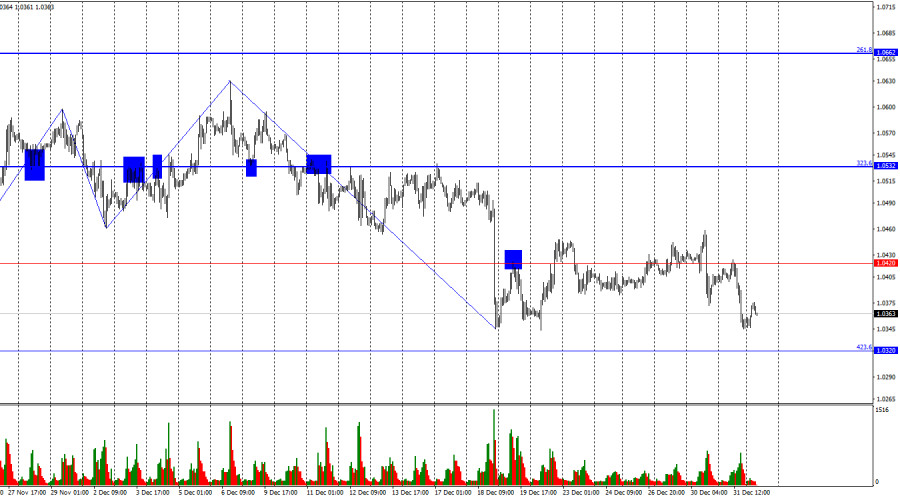
The EUR/USD pair on Tuesday returned to the 1.0420 level and rebounded from it. A reversal in favor of the US dollar occurred, and a new decline toward the 423.6% corrective level at 1.0320 began. However, the movement stopped for the third time near the 1.0346 level. I believe it is worth considering the support zone of 1.0320–1.0346 instead of just 1.0320. Breaking below this zone would open the path for further euro depreciation.
The wave situation remains clear. The last completed upward wave slightly broke the peak of the previous wave, while the last downward wave easily broke the previous low. Thus, a new bearish trend is forming, with no signs of completion. For these signs to appear, the euro must show a confident rise above the 1.0460 level.
There was no background information on Tuesday. Over the past few days, bears have shown a desire to resume the decline. They now need to break through the 1.0320–1.0346 zone mentioned earlier. When they might successfully break below this zone with a close beneath it remains unclear, as while the holidays are over, the festive mood lingers. The market might need some time to return to its usual rhythm. Today, several economic reports are expected from the EU, Germany, and the US, but they must support the dollar for bears to make another attempt to close below the 1.0320–1.0346 zone.
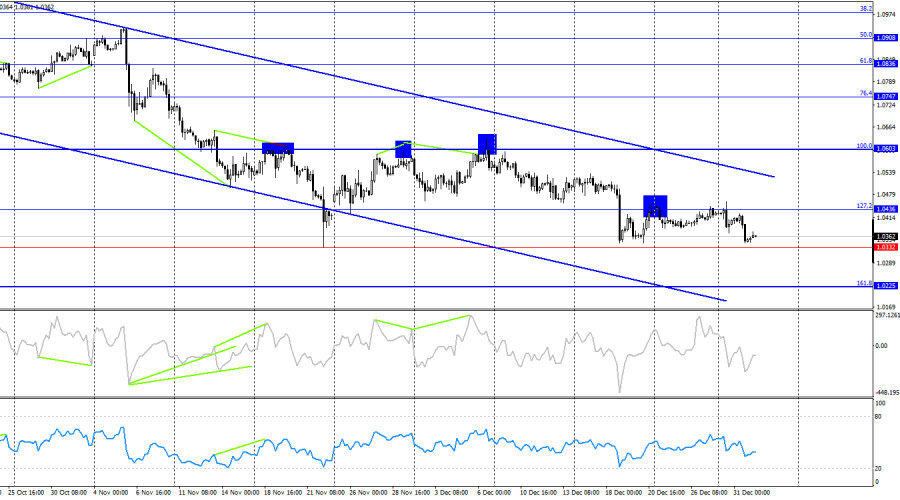
On the 4-hour chart, the pair has rebounded twice from the 127.2% corrective level at 1.0436. Thus, the decline could resume toward the Fibonacci 161.8% level at 1.0225. A consolidation above 1.0436 would open the potential for growth toward the upper boundary of the downward trend channel. There are no emerging divergences on any indicator. The trend channel does not provide reasons to expect significant euro growth.
Commitments of Traders (COT) Report:
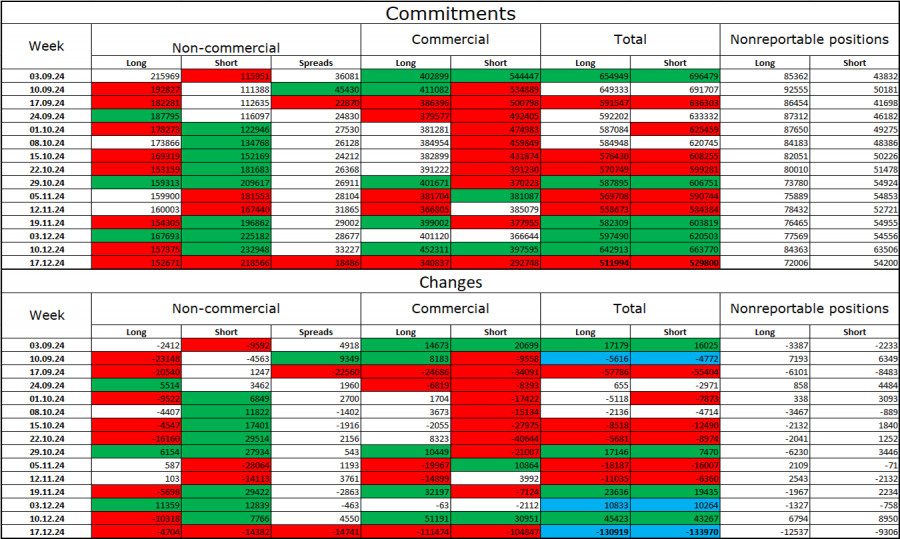
Over the last reporting week, speculators closed 4,704 long positions and 14,382 short positions. The sentiment in the "Non-commercial" group remains bearish and is strengthening, indicating a further decline for the pair. The total number of long positions held by speculators is now 152,000, while short positions amount to 218,000.
For fourteen consecutive weeks, major players have been reducing their euro holdings, signaling a bearish trend. Occasionally, bulls dominate within individual weeks, but this is more of an exception. The primary factor driving the dollar's decline—expectations of a Federal Open Market Committee (FOMC) policy shift—has already been priced in. There are no longer reasons for massive dollar selling. While these factors may arise over time, the US dollar's growth remains more probable. Graphical analysis also supports the continuation of the long-term bearish trend. Thus, I expect a prolonged decline for the EUR/USD pair.
Economic Calendar for the US and Eurozone:
The economic calendar for January 2nd contains four entries, none of which are highly significant. The influence of the information background on market sentiment today will likely be weak.
Forecast for EUR/USD and Trading Tips:
Fibonacci Levels:
You have already liked this post today
*The market analysis posted here is meant to increase your awareness, but not to give instructions to make a trade.
Useful links: My other articles are available in this section InstaForex course for beginners Popular Analytics Open trading account Important: The begginers in forex trading need to be very careful
Useful links: My other articles are available in this section InstaForex course for beginners Popular Analytics Open trading account Important: The begginers in forex trading need to be very careful
From what we see on the 4-hour chart of the Nasdaq 100 index, there are several interesting things, namely, first, the price movement is moving below the MA (100), second
Early in the American session, gold is trading around 3,312 with a bullish bias after breaking out of the symmetrical triangle. Gold is now likely to continue rising
Useful links: My other articles are available in this section InstaForex course for beginners Popular Analytics Open trading account Important: The begginers in forex trading need to be very careful
On the 4-hour chart, the USD/CAD commodity currency pair can be seen moving below the EMA (100) and the appearance of a Bearish 123 pattern and the position
Graphical patterns
indicator.
Notices things
you never will!
Forex Chart
Web-version

Your IP address shows that you are currently located in the USA. If you are a resident of the United States, you are prohibited from using the services of InstaFintech Group including online trading, online transfers, deposit/withdrawal of funds, etc.
If you think you are seeing this message by mistake and your location is not the US, kindly proceed to the website. Otherwise, you must leave the website in order to comply with government restrictions.
Why does your IP address show your location as the USA?
Please confirm whether you are a US resident or not by clicking the relevant button below. If you choose the wrong option, being a US resident, you will not be able to open an account with InstaTrade anyway.
We are sorry for any inconvenience caused by this message.


