See also


 07.11.2022 03:20 PM
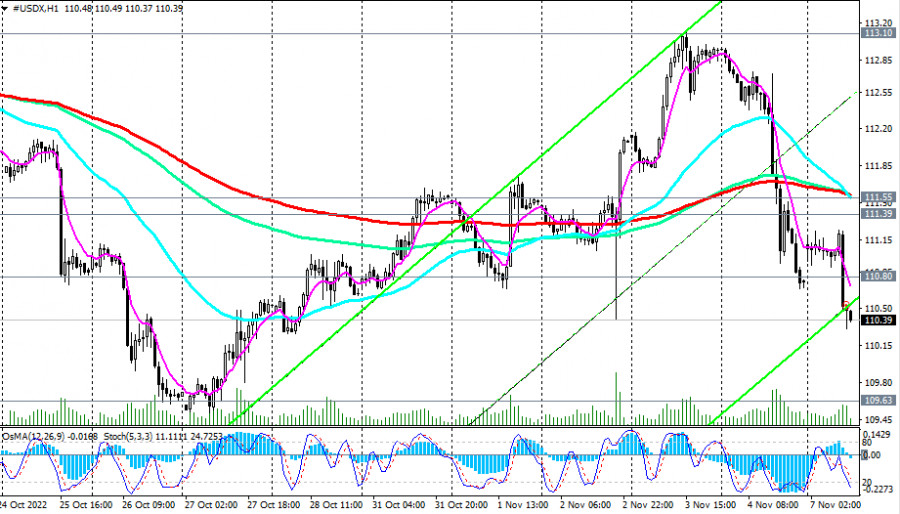
At the beginning of today's European trading session, the dollar is falling again, and the DXY dollar index has again moved into the "red" zone, dropping below Friday's low of 110.61 to 110.31 as of writing.
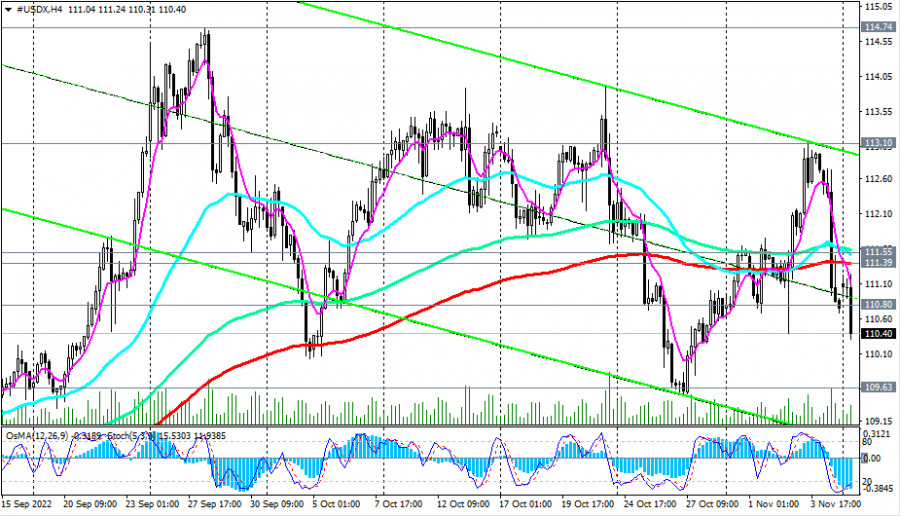
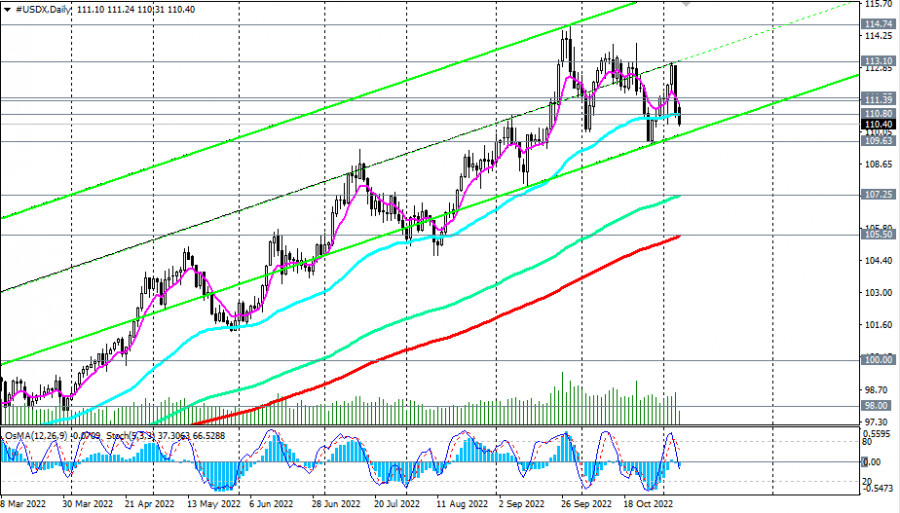
On Friday, the sellers managed to push the price below important support levels 111.55 (200 EMA on the 1-hour chart), 111.39 (200 EMA on the 4-hour chart), 110.80 (50 EMA on the daily chart).
The nearest support lies at the levels of 109.63, 109.00. Their breakdown will strengthen the negative dynamics of the dollar and CFD #USDX, sending it towards the key support levels 107.25 (144 EMA on the daily chart), 105.50 (200 EMA on the daily chart). But above them, the #USDX CFD remains in the long-term bull market zone. Therefore, when bullish drivers appear, dollar buyers will quickly take control of the situation again.
In turn, the growth of CFD #USDX in the area above the resistance level 111.55 will be the first signal to resume long positions.
Support levels: 109.63, 109.00, 107.25, 105.50
Resistance levels: 110.80, 111.39, 111.55, 113.10, 114.00, 114.74, 115.00
Trading Tips
Sell Stop 110.20. Stop Loss 110.90. Take Profit 109.70, 109.00, 107.25, 105.50
Buy Stop 110.90. Stop-Loss 110.20. Take-Profit 111.40, 111.55, 113.10, 114.00, 114.74, 115.00
You have already liked this post today
*The market analysis posted here is meant to increase your awareness, but not to give instructions to make a trade.
Analysis of Monday's Trades 1H Chart of GBP/USD On Monday, the GBP/USD pair rose by 130 pips. Such was the "boring Monday" without a macroeconomic report or important speech
Analysis of Monday's Trades 1H Chart of EUR/USD On Monday, the EUR/USD currency pair showed somewhat mixed movements, no matter how you look. On the one hand, the pair demonstrated
On Monday, the GBP/USD currency pair once again traded higher despite having no fundamental reasons. However, by now, all traders should be accustomed to such developments. While the euro tends
On Monday, the EUR/USD currency pair showed a decent upward movement during the day but remained within the narrow sideways channel of 1.1312–1.1414 (Kijun-sen line). Recall that the euro
In my morning forecast, I focused on the 1.1391 level and planned to make trading decisions from there. Let's look at the 5-minute chart and see what happened. Although there
Analysis of Friday's Trades 1H Chart of GBP/USD The GBP/USD pair also showed no interesting movements on Friday. Like the euro, the British pound remained very close to a flat
Analysis of Friday's Trades 1H Chart of EUR/USD The EUR/USD currency pair continued to trade sideways on Friday. The market continues to ignore all macroeconomic data, and last week once
The GBP/USD currency pair continued sideways trading on Friday, holding near three-year highs. The fact that the British pound refuses even a slight downward correction shows the market's disbelief
The EUR/USD currency pair continued trading sideways throughout Friday. In the second half of last week, the euro traded exclusively between the levels of 1.1321 and 1.1391, although the overall
Forex Chart
Web-version

Your IP address shows that you are currently located in the USA. If you are a resident of the United States, you are prohibited from using the services of InstaFintech Group including online trading, online transfers, deposit/withdrawal of funds, etc.
If you think you are seeing this message by mistake and your location is not the US, kindly proceed to the website. Otherwise, you must leave the website in order to comply with government restrictions.
Why does your IP address show your location as the USA?
Please confirm whether you are a US resident or not by clicking the relevant button below. If you choose the wrong option, being a US resident, you will not be able to open an account with InstaTrade anyway.
We are sorry for any inconvenience caused by this message.


