See also


 15.03.2023 01:45 PM
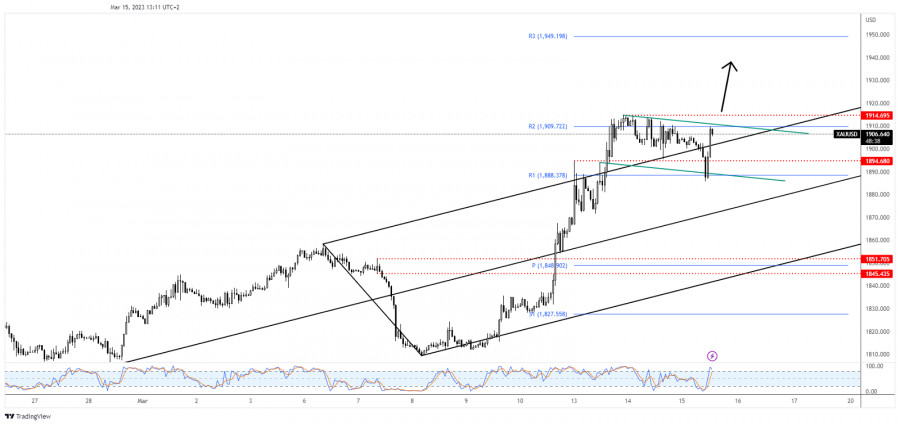
The price of gold rallied in the short term and now is trading at 1,910 at the time of writing. The bias remains bullish despite temporary retreats. You knew from my last analysis that XAU/USD could extend its growth after testing and retesting the support levels.
Today, the Chinese data came in mixed. Still, the US data could be decisive later today. The PPI and Core PPI could increase in the last month while the retail sales data could announce a potential drop in February. Positive US data should boost the USD and could force XAU/USD to slip lower. On the contrary, poor US economic figures should lift the yellow metal.
XAU/USD dropped a little but the sell-off ended after registering only a false breakdown below the channel's downside line and below the weekly R1 (1,888). Now, it could challenge the R2 (1,909, 1,914 static resistance), and the downtrend line.
Technically, the flag pattern (down channel) is seen as a potential upside continuation pattern. Still, we need confirmation before jumping into a long position.
Jumping and closing above 1,914 activates the flag pattern and announces further growth ahead. Validating its breakout above this obstacle represents a bullish signal.
You have already liked this post today
*The market analysis posted here is meant to increase your awareness, but not to give instructions to make a trade.
Analysis of Tuesday's Trades 1H Chart of GBP/USD On Tuesday, the GBP/USD pair corrected downward after another surge on Monday. No fundamental or macroeconomic reasons supported such movements on either
Analysis of Tuesday's Trades 1H Chart of EUR/USD On Tuesday, the EUR/USD currency pair continued to trade within a sideways channel, which is now visible on virtually any timeframe
On Tuesday, the GBP/USD currency pair failed to continue the upward movement it had started so vigorously on Monday. It is worth recalling that there were no solid reasons
The EUR/USD currency pair continued to trade within a sideways channel throughout Tuesday. The flat movement is visible in the chart above. Last week, the pair briefly broke
In my morning forecast, I highlighted the 1.3421 level and planned to make trading decisions based on it. Let's look at the 5-minute chart and see what happened. The pound
Analysis of Monday's Trades 1H Chart of GBP/USD On Monday, the GBP/USD pair rose by 130 pips. Such was the "boring Monday" without a macroeconomic report or important speech
Analysis of Monday's Trades 1H Chart of EUR/USD On Monday, the EUR/USD currency pair showed somewhat mixed movements, no matter how you look. On the one hand, the pair demonstrated
Your IP address shows that you are currently located in the USA. If you are a resident of the United States, you are prohibited from using the services of InstaFintech Group including online trading, online transfers, deposit/withdrawal of funds, etc.
If you think you are seeing this message by mistake and your location is not the US, kindly proceed to the website. Otherwise, you must leave the website in order to comply with government restrictions.
Why does your IP address show your location as the USA?
Please confirm whether you are a US resident or not by clicking the relevant button below. If you choose the wrong option, being a US resident, you will not be able to open an account with InstaTrade anyway.
We are sorry for any inconvenience caused by this message.

