See also


 24.11.2021 04:45 AM
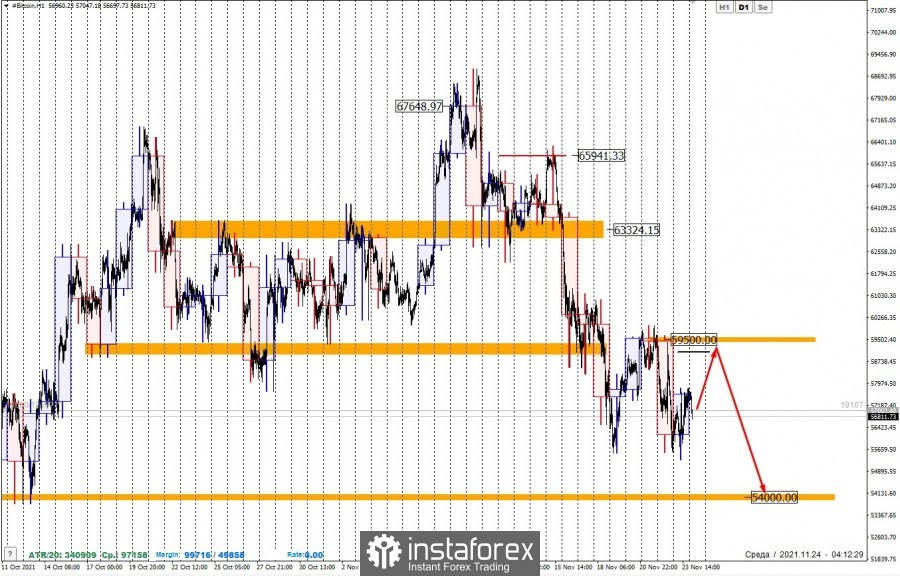
Bitcoin's downward movement that happened in the first half of November is a bearish impulse. The significant support level of $ 59250 was broken, which makes it possible to consider a subsequent decline.
The level of $ 54,000 is considered as the nearest downward target. This support level was formed in early October but has not lost its relevance. If its local high is not updated this week, the decline will continue.
There is a 75% probability of testing the $ 54,000 mark. This allows us to hold open sales and look for opportunities for new short trades. The level of $ 59,500 is great for this purpose, at which the defining resistance is located.
It is important to understand that Bitcoin's price decline will most likely continue in the medium term. The daily candle, which was formed last Monday, indicates the advantage of sellers in this market area. It will be possible to consider purchases only after the absorption of this downward trend. The price reduction has already amounted to 20%, which is a strong signal for a priority shift.
You have already liked this post today
*The market analysis posted here is meant to increase your awareness, but not to give instructions to make a trade.
In my morning forecast, I focused on the 1.1391 level and planned to make trading decisions from there. Let's look at the 5-minute chart and see what happened. Although there
Analysis of Friday's Trades 1H Chart of GBP/USD The GBP/USD pair also showed no interesting movements on Friday. Like the euro, the British pound remained very close to a flat
Analysis of Friday's Trades 1H Chart of EUR/USD The EUR/USD currency pair continued to trade sideways on Friday. The market continues to ignore all macroeconomic data, and last week once
The GBP/USD currency pair continued sideways trading on Friday, holding near three-year highs. The fact that the British pound refuses even a slight downward correction shows the market's disbelief
The EUR/USD currency pair continued trading sideways throughout Friday. In the second half of last week, the euro traded exclusively between the levels of 1.1321 and 1.1391, although the overall
Analysis of Thursday's Trades 1H Chart of GBP/USD The GBP/USD pair continued to trade upward on Thursday despite the absence of any objective reasons for such movement. There were
InstaTrade video
analytics
Daily analytical reviews
Forex Chart
Web-version

Your IP address shows that you are currently located in the USA. If you are a resident of the United States, you are prohibited from using the services of InstaFintech Group including online trading, online transfers, deposit/withdrawal of funds, etc.
If you think you are seeing this message by mistake and your location is not the US, kindly proceed to the website. Otherwise, you must leave the website in order to comply with government restrictions.
Why does your IP address show your location as the USA?
Please confirm whether you are a US resident or not by clicking the relevant button below. If you choose the wrong option, being a US resident, you will not be able to open an account with InstaTrade anyway.
We are sorry for any inconvenience caused by this message.

