实际模式

模式是通过价格在图表中形成的图形模型。 根据其中一项技术分析规定,历史(价格变动)重演。 这意味着价格变动在相同的情况下通常是相似的,这使得有可能以高概率预测情况的进一步发展。
InstaTrade的相关模式是一款易于使用的服务,可让您了解市场的最新变化并及时对市场线索做出反应。 在我们的服务中,您始终可以在任何货币对以及任何时间范围内找到最新和最相关的模式。
Actual Patterns
- All
- All
- Bearish Rectangle
- Bearish Symmetrical Triangle
- Bearish Symmetrical Triangle
- Bullish Rectangle
- Double Top
- Double Top
- Triple Bottom
- Triple Bottom
- Triple Top
- Triple Top
- All
- All
- Buy
- Sale
- All
- 1
- 2
- 3
- 4
- 5
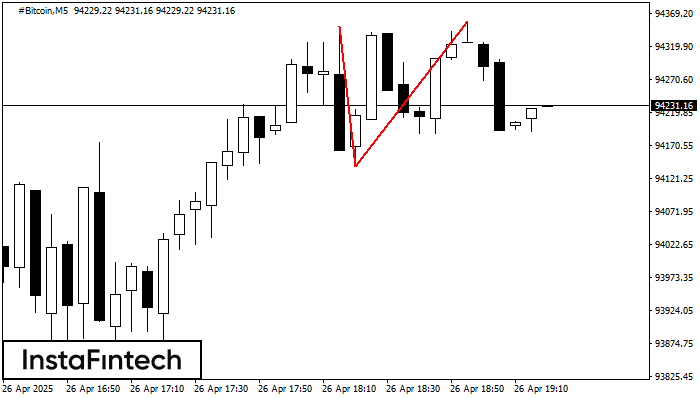
Triple Top
сформирован 26.04 в 20:16:22 (UTC+0)
сила сигнала 1 из 5

On the chart of the #Bitcoin M5 trading instrument, the Triple Top pattern that signals a trend change has formed. It is possible that after formation of the third peak
The M5 and M15 time frames may have more false entry points.
Открыть график инструмента в новом окне
Double Top
сформирован 26.04 в 18:20:15 (UTC+0)
сила сигнала 1 из 5
The Double Top reversal pattern has been formed on #Bitcoin M5. Characteristics: the upper boundary 94348.84; the lower boundary 94140.31; the width of the pattern is 21661 points. Sell trades
The M5 and M15 time frames may have more false entry points.
Открыть график инструмента в новом окне
Triple Bottom
сформирован 26.04 в 07:45:27 (UTC+0)
сила сигнала 2 из 5

The Triple Bottom pattern has formed on the chart of the #Bitcoin M15 trading instrument. The pattern signals a change in the trend from downwards to upwards in the case
The M5 and M15 time frames may have more false entry points.
Открыть график инструмента в новом окне
Double Top
сформирован 25.04 в 22:10:22 (UTC+0)
сила сигнала 1 из 5

The Double Top pattern has been formed on AUDUSD M5. It signals that the trend has been changed from upwards to downwards. Probably, if the base of the pattern 0.6399
The M5 and M15 time frames may have more false entry points.
Открыть график инструмента в новом окне
Double Top
сформирован 25.04 в 22:00:31 (UTC+0)
сила сигнала 2 из 5

On the chart of GBPUSD M15 the Double Top reversal pattern has been formed. Characteristics: the upper boundary 1.3332; the lower boundary 1.3315; the width of the pattern 17 points
The M5 and M15 time frames may have more false entry points.
Открыть график инструмента в новом окне
Double Top
сформирован 25.04 в 22:00:30 (UTC+0)
сила сигнала 4 из 5

On the chart of EURNZD H1 the Double Top reversal pattern has been formed. Characteristics: the upper boundary 1.9079; the lower boundary 1.9023; the width of the pattern 56 points
Открыть график инструмента в новом окне
Bullish Symmetrical Triangle
сформирован 25.04 в 21:42:43 (UTC+0)
сила сигнала 1 из 5
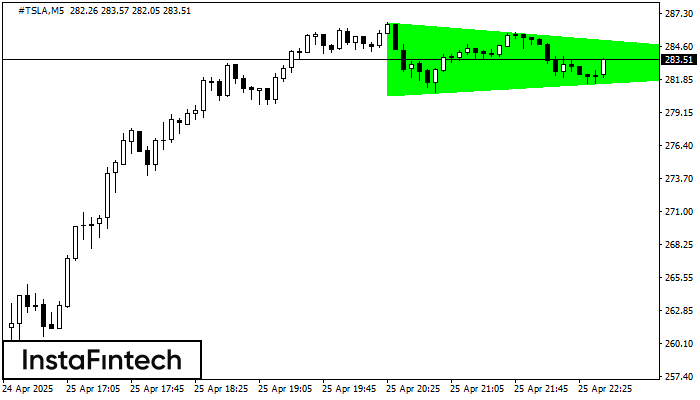
According to the chart of M5, #TSLA formed the Bullish Symmetrical Triangle pattern. Description: This is the pattern of a trend continuation. 286.59 and 280.59 are the coordinates
The M5 and M15 time frames may have more false entry points.
Открыть график инструмента в новом окне
Bullish Symmetrical Triangle
сформирован 25.04 в 21:42:41 (UTC+0)
сила сигнала 1 из 5
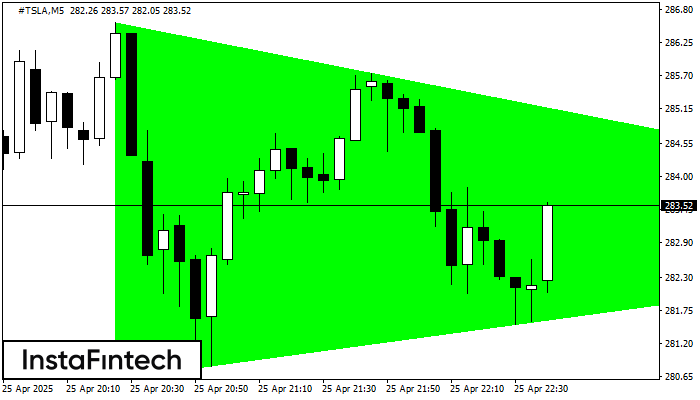
According to the chart of M5, #TSLA formed the Bullish Symmetrical Triangle pattern. Description: This is the pattern of a trend continuation. 286.59 and 280.59 are the coordinates
The M5 and M15 time frames may have more false entry points.
Открыть график инструмента в новом окне
Inverse Head and Shoulder
сформирован 25.04 в 21:30:17 (UTC+0)
сила сигнала 2 из 5
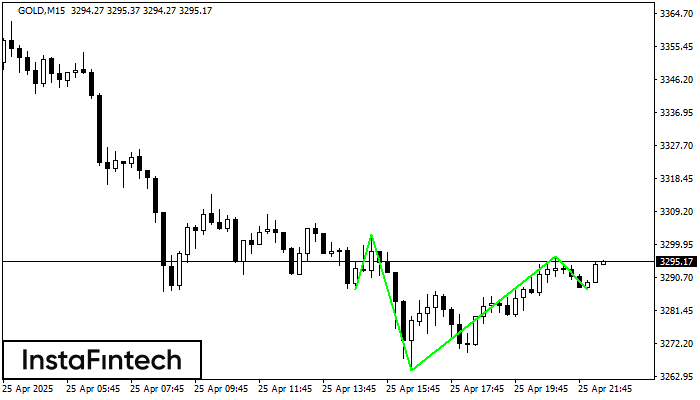
According to M15, GOLD is shaping the technical pattern – the Inverse Head and Shoulder. In case the Neckline 3302.69/3296.57 is broken out, the instrument is likely to move toward
The M5 and M15 time frames may have more false entry points.
Открыть график инструмента в новом окне