
 09.01.2024 11:08 AM
Eurozone retail sales decreased by 0.3% in November compared to the previous month, matching analysts' forecasts.
In terms of the information flow, there were speeches by Federal Reserve representatives. One of them expressed the opinion about a possible increase in the refinancing rate in case of inflation growth in the USA, while another head of the Federal Reserve Bank, on the contrary, considers an early reduction of the key rate.
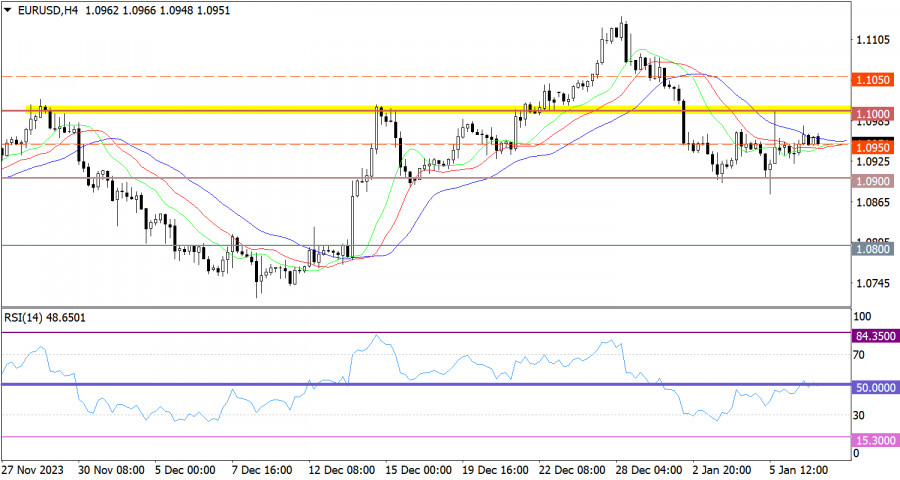
The EUR/USD currency pair has been relatively stable since last Friday, forming doji candles on the daily chart. This price action indicates a characteristic stagnation, which could lead to an accumulation of trading forces.
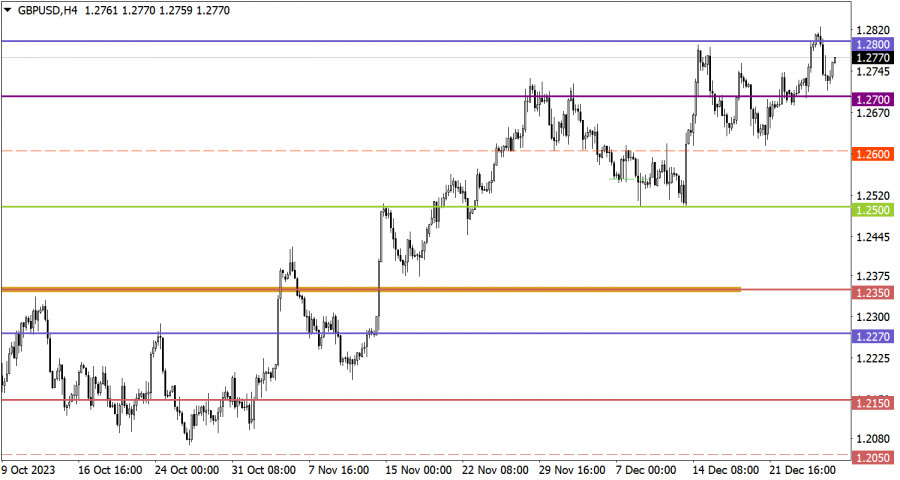
The GBP/USD currency pair shows an upward trend over several days. However, when examining the trading chart over several weeks, a characteristic flat is observed between the levels of 1.2600 and 1.2700.
Today, the main focus should be on the unemployment rate in the European Union, which is expected to rise from 6.5% to 6.6%. This could potentially lead to some weakening of the euro if the data matches the statistics.
Prolonged stagnation at one level can eventually lead to speculative price jumps. For this reason, the current stagnation should be considered as a lever for subsequent price movements. The optimal approach is the method of outgoing impulse, which takes into account a local spike in activity.
In this case, the upward cycle began from the lower boundary at 1.2600. It is possible that near the 1.2700 mark, there will be a reduction in the volume of long positions, which could lead to a slowdown in the upward cycle.
The candlestick chart type is white and black graphic rectangles with lines above and below. With a detailed analysis of each individual candle, you can see its characteristics relative to a particular time frame: opening price, closing price, intraday high and low.
Horizontal levels are price coordinates, relative to which a price may stop or reverse its trajectory. In the market, these levels are called support and resistance.
Circles and rectangles are highlighted examples where the price reversed in history. This color highlighting indicates horizontal lines that may put pressure on the asset's price in the future.
The up/down arrows are landmarks of the possible price direction in the future.
You have already liked this post today
*The market analysis posted here is meant to increase your awareness, but not to give instructions to make a trade.
يوم الخميس، واصل زوج الجنيه الإسترليني/الدولار الأمريكي تراجعه المتقلب داخل القناة الجانبية وفشل في الخروج منها، على عكس زوج اليورو/الدولار الأمريكي. من وجهة نظرنا، كان لدى الجنيه الإسترليني ضعف الأسباب
يوم الخميس، استمر زوج العملات GBP/USD في التداول ضمن القناة الجانبية، المرئية في الإطار الزمني الساعي. لم تتمكن اجتماعات البنكين المركزيين - اللذين كان من الممكن اعتبارهما إيجابيين للدولار الأمريكي
أظهر زوج العملات EUR/USD اتجاهًا مثيرًا للاهتمام بشكل خاص يوم الخميس. للتذكير، تم الإعلان عن نتائج اجتماع اللجنة الفيدرالية للسوق المفتوحة مساء الأربعاء، واعتبرناها مرة أخرى متشددة. من المهم
لم يظهر زوج الجنيه الإسترليني/الدولار الأمريكي أي تحركات ملحوظة يوم الأربعاء. بعد أن صرح جيروم باول بالحاجة إلى مزيد من الوقت لتقييم التأثير الاقتصادي الكامل لتعريفات ترامب، تعزز الدولار الأمريكي
Your IP address shows that you are currently located in the USA. If you are a resident of the United States, you are prohibited from using the services of InstaFintech Group including online trading, online transfers, deposit/withdrawal of funds, etc.
If you think you are seeing this message by mistake and your location is not the US, kindly proceed to the website. Otherwise, you must leave the website in order to comply with government restrictions.
Why does your IP address show your location as the USA?
Please confirm whether you are a US resident or not by clicking the relevant button below. If you choose the wrong option, being a US resident, you will not be able to open an account with InstaTrade anyway.
We are sorry for any inconvenience caused by this message.


